1
2
3
4
5
6
7
8
9
10
11
12
13
14
15
16
17
18
19
20
21
22
23
24
25
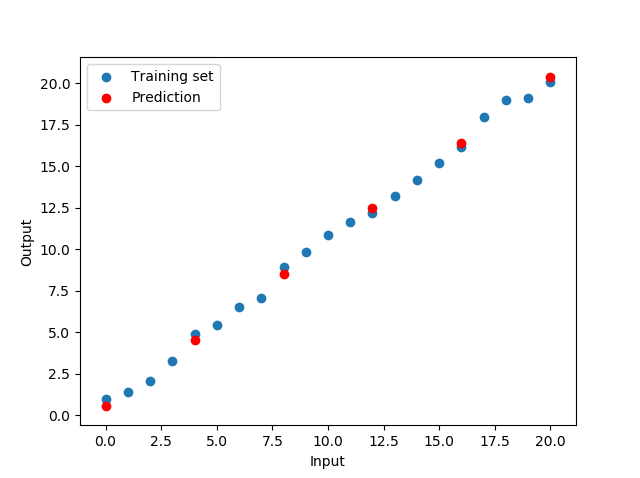
| import numpy as np
import matplotlib.pyplot as plt
from sklearn.linear_model import LinearRegression
# Creation d'un jeux de données basique
x = np.linspace(0, 20, 21)
y = x + np.random.rand(21)
X_train, y_train = np.vstack(x), y
X_test = np.vstack(np.linspace(0, 20, 6))
# Model de regression
regressor = LinearRegression()
regressor.fit(X_train, y_train)
prediction = regressor.predict(X_test)
# On fait un petit graph
fig, ax = plt.subplots()
ax.scatter(np.hstack(X_train), y_train, label='Training set')
ax.scatter(np.hstack(X_test), prediction, color='red', label='Prediction')
ax.set_xlabel('Input')
ax.set_ylabel('Output')
ax.legend()
plt.show() |


")
 Répondre avec citation


Partager