1
2
3
4
5
6
7
8
9
10
11
12
13
14
15
16
17
18
19
20
21
22
23
24
25
26
27
28
29
30
31
32
33
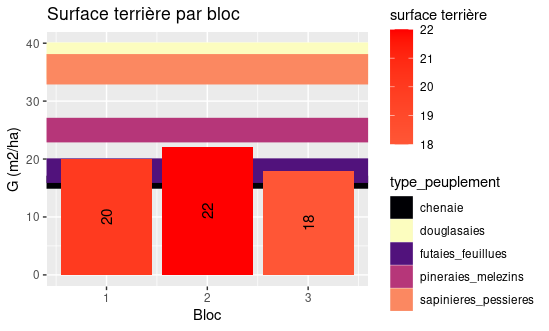
| library(tidyverse)
df <- data.frame(bloc = c(1, 2, 3),
g = c(20,22,18))
cible <- data.frame(type_peuplement= c("chenaie","futaies_feuillues",
"pineraies_melezins","sapinieres_pessieres",
"douglasaies"),
ymin = c(15,16,23,33,34),
ymax = c(17,20,27,38,40))
cible2 <- pivot_wider(cible,
names_from=type_peuplement,
values_from = c(ymin, ymax))
df2 <- df %>%
left_join(cible2, by=character())
ggplot(df2)+
geom_rect(aes(ymin=ymin_chenaie, ymax=ymax_chenaie),
fill=viridis::magma(5)[[1]], alpha=0.5) +
geom_rect(aes(ymin=ymin_futaies_feuillues, ymax=ymax_futaies_feuillues),
fill=viridis::magma(5)[[2]], alpha=0.5) +
geom_rect(aes(ymin=ymin_pineraies_melezins, ymax=ymax_pineraies_melezins),
fill=viridis::magma(5)[[3]], alpha=0.5) +
geom_rect(aes(ymin=ymin_sapinieres_pessieres, ymax=ymax_sapinieres_pessieres),
fill=viridis::magma(5)[[4]], alpha=0.5) +
geom_rect(aes(ymin=ymin_douglasaies, ymax=ymax_douglasaies),
fill=viridis::magma(5)[[5]], alpha=0.5) +
aes(x = bloc, y = g, fill = g, xmin=-Inf, xmax=Inf, label = g) +
geom_bar(stat='identity', orientation = "x") +
labs(x = "Bloc", y = "G (m2/ha)", fill = "surface terrière", title = "Surface terrière par bloc")+
geom_text(aes(y=g/2), size = 4, angle = 90) +
scale_fill_gradient2(low = "yellow", high = "red", na.value = NA) |


 Répondre avec citation


Partager