1
2
3
4
5
6
7
8
9
10
11
12
13
14
15
16
17
18
19
20
21
22
23
24
25
26
27
28
29
30
31
32
33
34
35
36
37
38
39
40
41
| import matplotlib.pyplot as plt
import pandas as pd
"""
tensions=pd.read_excel('./Dataset/Tensions.xls',index_col='date',parse_dates=True)
tensions.drop('PLS',axis='columns', inplace=True)
tensions.index=tensions.index.strftime("%Y/%m/%d %H")
"""
tensions=pd.DataFrame({'SYS': {'2026/08/29 10': 16,
'2026/08/29 17': 16,
'2026/08/30 10': 15,
'2026/08/30 17': 16,
'2026/08/31 10': 17,
'2026/09/01 10': 17,
'2026/09/01 18': 17,
'2026/09/02 10': 15,
'2026/09/02 17': 20,
'2026/09/03 10': 14},
'DIA': {'2026/08/29 10': 8,
'2026/08/29 17': 8,
'2026/08/30 10': 9,
'2026/08/30 17': 8,
'2026/08/31 10': 9,
'2026/09/01 10': 14,
'2026/09/01 18': 9,
'2026/09/02 10': 7,
'2026/09/02 17': 9,
'2026/09/03 10': 7}})
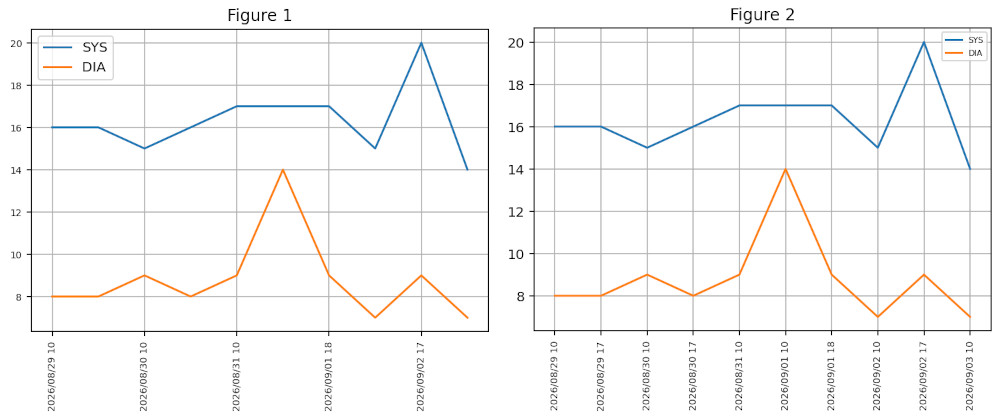
tensions.plot(fontsize=7,rot=90,grid='True',title='Figure 1')
fig, ax1 = plt.subplots()
ax1.plot(tensions.index,tensions['SYS'],label='SYS')
ax1.plot(tensions.index,tensions['DIA'],label='DIA')
plt.title('Figure 2')
plt.legend(fontsize=6)
plt.xticks(fontsize=7,rotation=90)
plt.grid(True) |




 Différence entre pandas.plot() et plt.subplots()

 Répondre avec citation


Partager