1
2
3
4
5
6
7
8
9
10
11
12
13
14
15
16
17
18
19
20
21
22
23
24
25
26
27
28
29
30
31
32
33
34
35
36
37
38
39
40
41
42
43
44
45
46
47
48
49
50
51
52
53
54
55
56
57
58
59
60
61
62
63
64
65
66
67
68
69
70
|
#**************** choix à faire
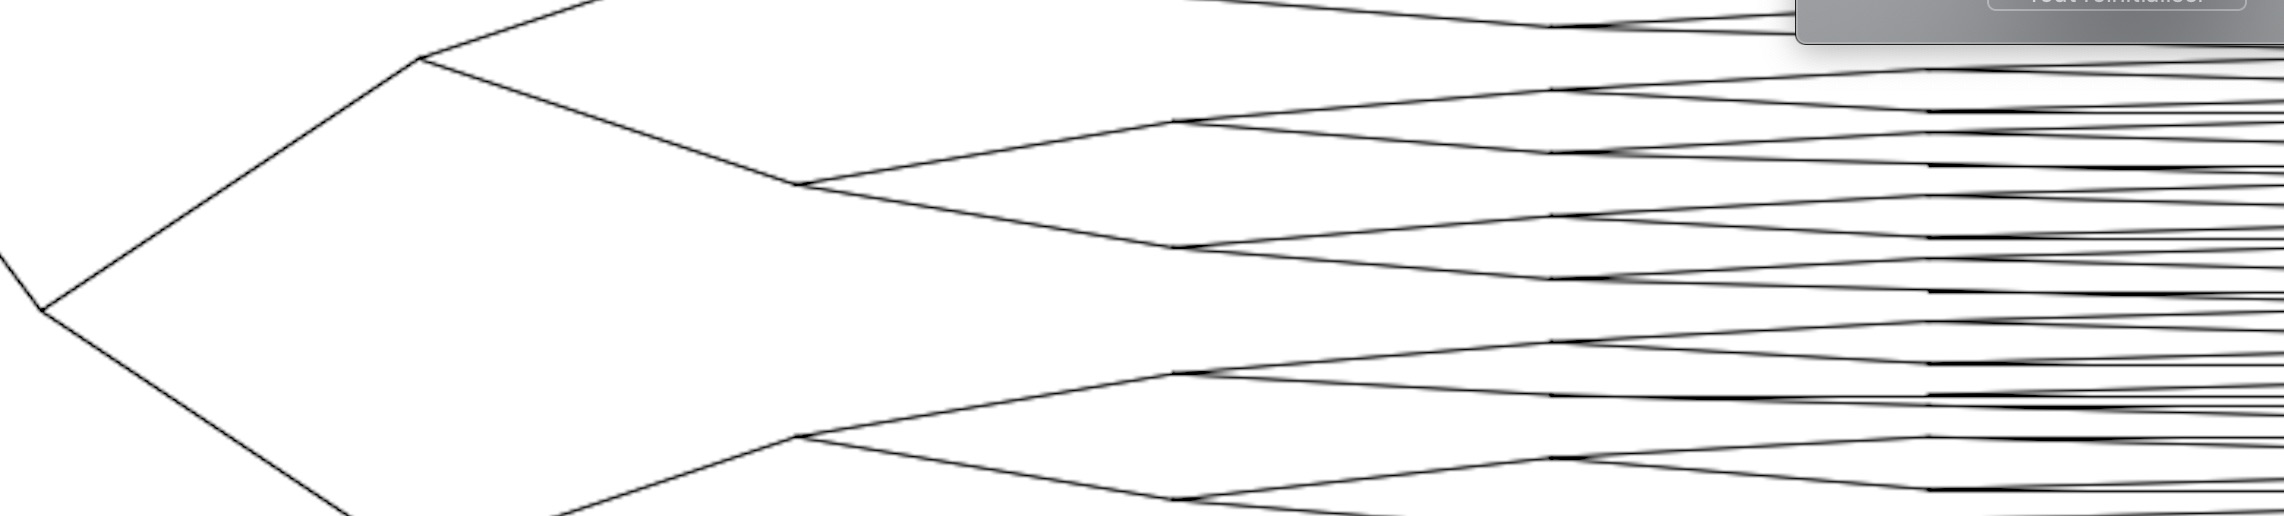
N=8#nombre de niveaux de branches. Typiquement, N=2 ou N=3
path="/Users/vincentdouce/Desktop/arbre"+str(N)+".png"
#inversés
#http://python-simple.com/python-matplotlib/ajout-text.php
import numpy as np
import matplotlib.pyplot as plt
import matplotlib as mpl
Np2=2**N
# dimensions de la fenêtre
xmin,xmax,ymin,ymax=-1,1,-1,1
(L,l)=(6,4)
Linch,linch=(L/2.54,l/2.54)
plt.axis([xmin,xmax,ymin,ymax])
fig, lafigure = plt.subplots(figsize=(Linch,linch))
plt.axis('off')
#calcul des positions verticales des branches de niveau maximal
epy=0.05#espacement par rapport aux bords supérieur et inférieur
yN=[0]*(N+1)#N+1 liste d'ordonnees
deltay=(ymax-ymin-2*epy)/(Np2-1)
yN[N]=[round(ymin+epy+i*deltay,2) for i in range(2**N)]#on commence larbre par la fin
for abs in range(N-1,-1,-1):#pour chaque niveau en descendant de N-1 a 0
yN[abs]=[0]*(2**abs)
for yyy in range(2**abs):
yN[abs][yyy]=round((yN[abs+1][2*yyy]+yN[abs+1][2*yyy+1])/2,2)
#le round a cause des virgules flottantes penibles de python
#la liste yN contient ainsi N sous-listes
#yN[0] contient 1 ordonnee... yN[N] en contient 2**N
#duplication des listes yN[i] de i=0 a i=N-1
def dupliquer(laliste):
longueur=len(laliste)
LL=[x for x in laliste]#on duplique
LL=LL+[0]*longueur#on double la taille
for i in range(longueur):
element=laliste[i]
LL[2*i]=element
LL[2*i+1]=element
return(LL)
yNdup=[0]*len(yN)
for i in range(N):
yNdup[i]=dupliquer(yN[i])
#calcul des N+1 abscisses
epx=0.05#espacement par rapport aux bords supérieur et inférieur
xN=[0]*(N+1)
deltax=(xmax-xmin-2*epx)/(Np2-1)
xN=[xmin+epx+i*deltax for i in range(N+1)]
for prof in range(1,N+1):
labscissegauche=xN[prof-1]
labscissedroite=xN[prof]
for niv in range(2**prof):
print([labscissegauche,labscissedroite],[yNdup[prof-1][niv],yN[prof][niv]])
lafigure.plot([labscissegauche,labscissedroite],[yNdup[prof-1][niv],yN[prof][niv]], color ='black', linewidth=0.25, linestyle="-")
plt.savefig(path, dpi=288)
plt.show() |


 Répondre avec citation


Partager