1
2
3
4
5
6
7
8
9
10
11
12
13
14
15
16
17
18
19
20
21
22
23
24
25
26
27
28
29
30
31
32
33
34
35
36
37
38
39
40
41
42
|
$('#charts .container').each(function(){
l_abels=[];
d_ata=[];
unit="";
sensor_id_class = 'sensor-' + $(this).attr('data-idsensor');
$('.' + sensor_id_class + ' .data').each(function(){
console.log("\tx: ",$(this).data('x'));
l_abels.push($(this).data('x'));
//datas['labels'].push($(this).attr('data-x'));
console.log("\ty: ",$(this).data('y'));
d_ata.push(parseFloat($(this).data('y').replaceAll(',', '.')).toFixed(2));
unit = $(this).data('unit');
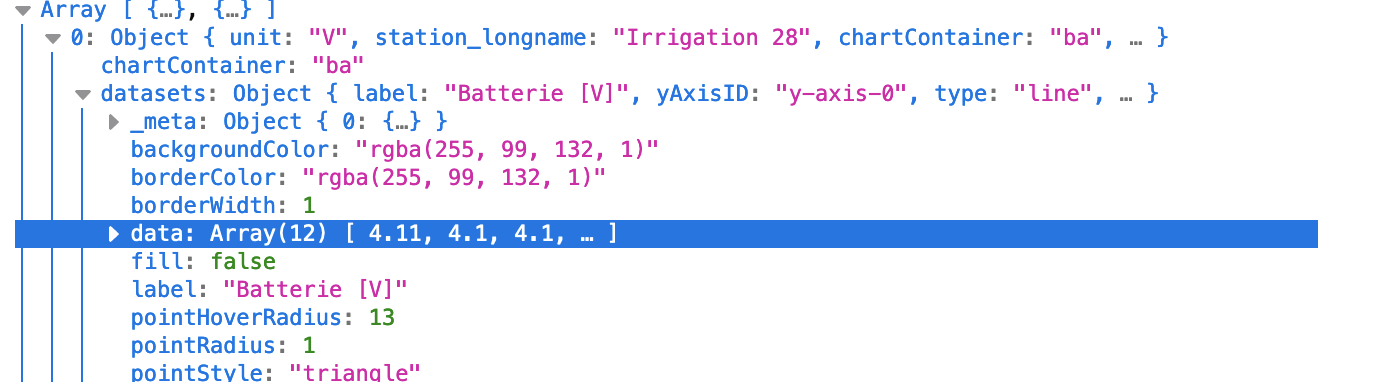
datasets = [{
label : $(this).data('sensor_longname'),
data : d_ata,
borderColor: "rgba(" + $(this).data('bordercolor') + ",1)",
backgroundColor: "rgba(" + $(this).data('backgroundcolor') + ",1)",
type: $(this).data('chart_style'),
borderWidth: $(this).data('chart_borderwidth'),
showLine:$(this).data('showline'),
pointHoverRadius:$(this).data('chart_pointhoverradius'),
pointRadius:$(this).data('chart_pointradius'),
fill:$(this).data('chart_fill'),
}]
});
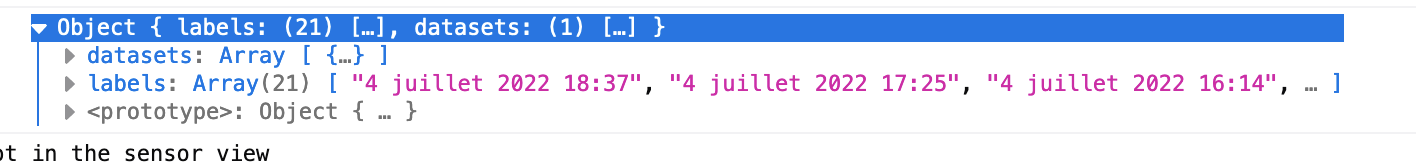
console.log("l_abels: ",l_abels)
console.log("d_atas", d_ata)
datas = {
labels: l_abels,
datasets : datasets,
}; |


 Répondre avec citation


Partager