


Bonjour,
J'utilise un code R pour créer des plots de régression linéaire d'une de mes variable pour chacun de mes fichiers.
Mon code marche très bien mais je souhaiterai y rajouter un nouveau modèle (en d'autre terme, je souhaiterai faire apparaître une seconde courbe en bleu par exemple) .
voici le code utilisé pour former mes plot de régression simple à une courbe :
Voici un exemple de fichier :
Code : Sélectionner tout - Visualiser dans une fenêtre à part
2
3
4
5
6
7
8
9
10
11
12
13
14
15
16
17
18
19
20
21
22
23
24
25
26
27
28
29
30
31
32
33
34
35
36
37
38
39
40
41
42
43
44
45
46
47
48
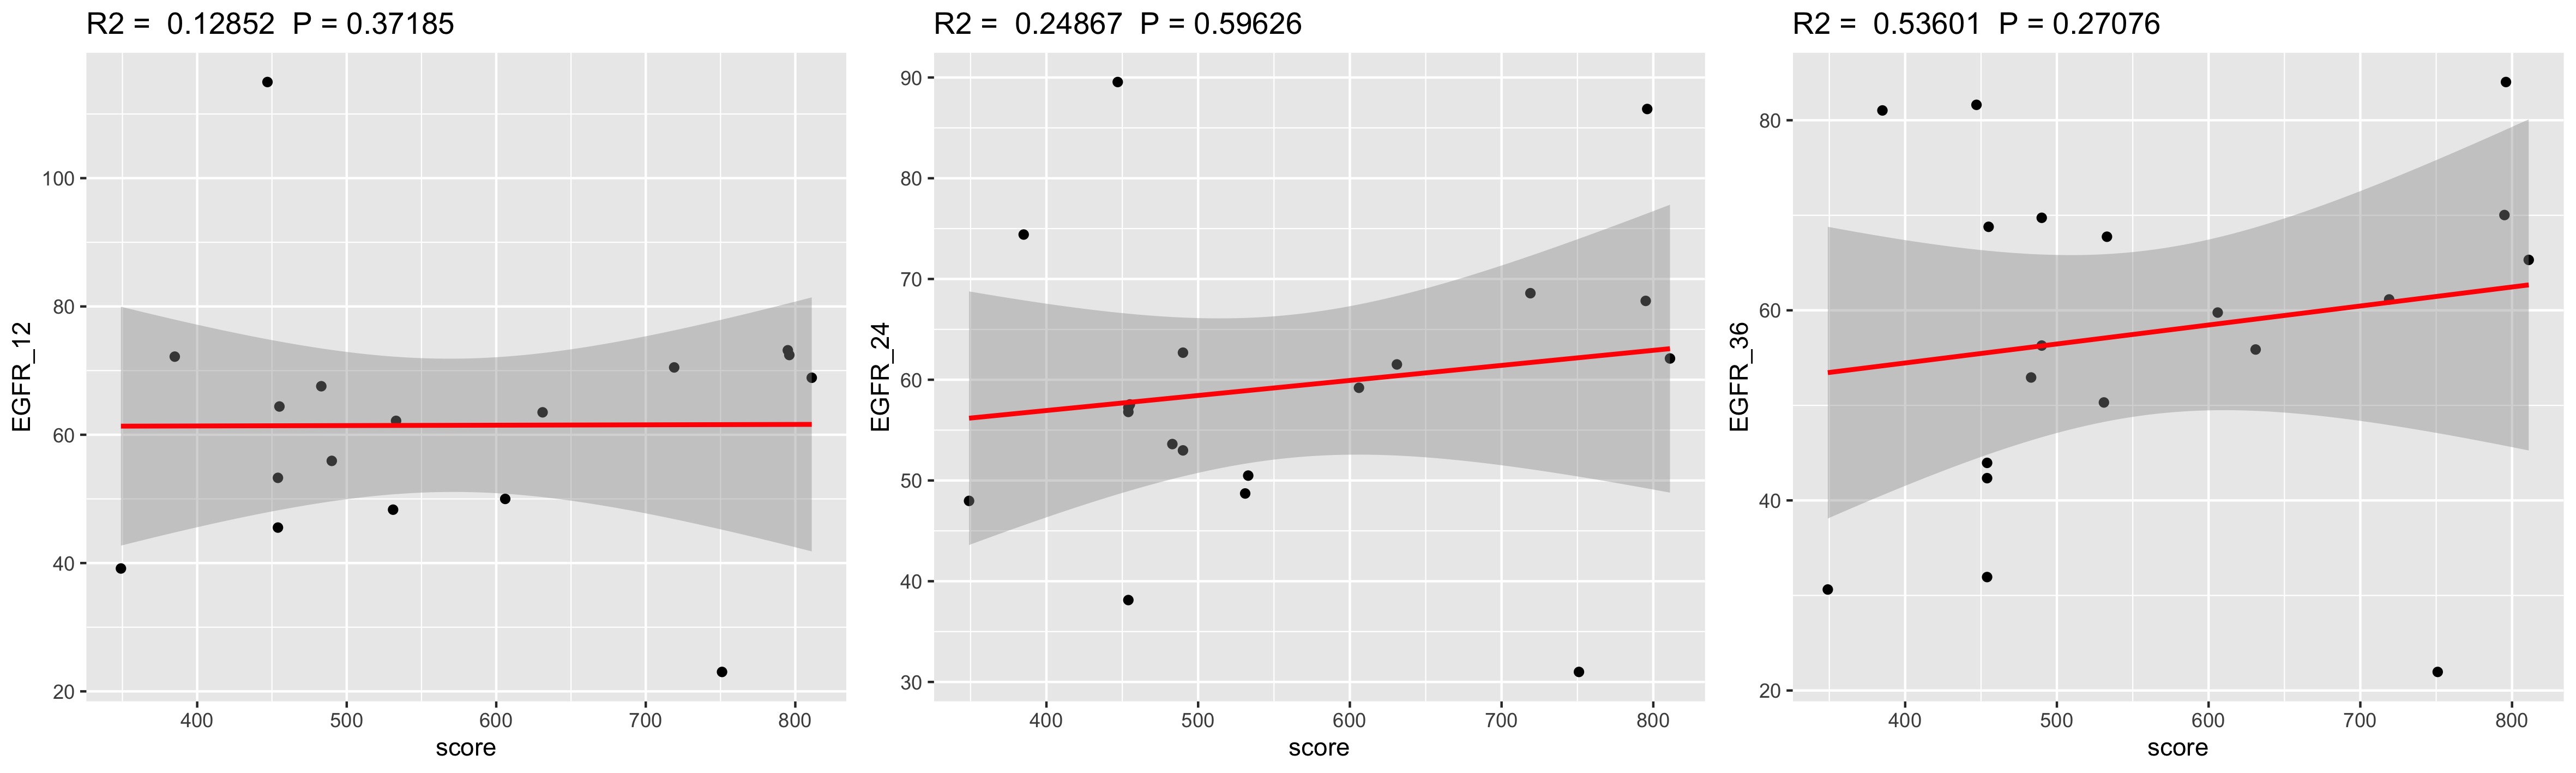
plot obtenu :
Code : Sélectionner tout - Visualiser dans une fenêtre à part
2
3
4
5
J'ai donc effectué pour chaque variable EGFR une lm avec score mais désormais je souhaiterai ajouter sur le même plot une lm en bleu représentant la régression de AMS avec chaque variables EGFR.
J'ai tenté pour chaque variables de créer un model1 de lmet de l'ajouter via la fonction ggplotRegression :
Code : Sélectionner tout - Visualiser dans une fenêtre à part (model1 <- lm(EGFR_12 ~ AMS, data = fichier, na.action=na.omit)
Vous serez t-il possible de m'aider ?
Code : Sélectionner tout - Visualiser dans une fenêtre à part
2
3
4
5
6
7
8
9
10
11
12
13
Merci
 Répondre avec citation
Partager