1
2
3
4
5
6
7
8
9
10
11
12
13
14
15
16
17
18
19
20
21
22
23
24
25
26
27
28
29
30
31
32
33
34
35
36
37
38
39
40
41
42
43
44
45
46
47
48
49
50
51
52
53
54
55
56
57
58
59
60
61
62
63
64
65
66
67
68
69
70
71
72
73
74
75
76
77
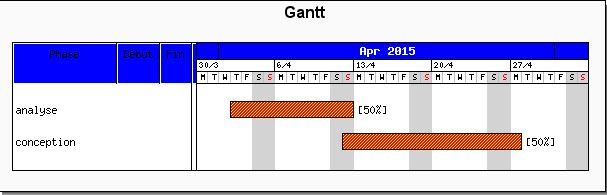
| <?php
// content="text/plain; charset=utf-8"
require_once ('src/jpgraph.php');
require_once ('src/jpgraph_gantt.php');
$graph = new GanttGraph();
$graph->SetShadow();
// Add title and subtitle
$graph->title->Set("Gantt");
$graph->title->SetFont(FF_ARIAL,FS_BOLD,12);
// Show day, week and month scale
$graph->ShowHeaders(GANTT_HDAY | GANTT_HWEEK | GANTT_HMONTH);
// Instead of week number show the date for the first day in the week
// on the week scale
$graph->scale->week->SetStyle(WEEKSTYLE_FIRSTDAY);
// Make the week scale font smaller than the default
$graph->scale->week->SetFont(FF_FONT0);
//TITRE
$graph->scale->actinfo->SetColTitles(
$tableau=array('Phase','Début','Fin'),array(100));
$graph->scale->actinfo->SetBackgroundColor('blue');
// Use the short name of the month together with a 2 digit year
// on the month scale
$graph->scale->month->SetStyle(MONTHSTYLE_SHORTNAMEYEAR4);
$graph->scale->month->SetFontColor("white");
$graph->scale->month->SetBackgroundColor("blue");
// 0 % vertical label margin
$graph->SetLabelVMarginFactor(1.0); // 1=default value
// Set zoom factor
$graph->SetZoomFactor(1.0);
//connexion à la base de donnée
mysql_connect('localhost', 'root', '');
mysql_select_db('gantt') ;
$requete=("SELECT nom , date_debut, date_fin FROM ga ");
$req=mysql_query($requete) or exit('Erreur SQL ligne '.__LINE__.' : '.mysql_error());
$donnée = array();
$x=0;
while($ligne=mysql_fetch_array($req))
{
$name=$ligne[0];
$db=$ligne[1];
$df=$ligne[2];
// Format the bar for the first activity
// ($row,$title,$startdate,$enddate)
$donnée = new GanttBar ("$x","$name","$db","$df","[50%]");
$x++;
// Yellow diagonal line pattern on a red background
$donnée->SetPattern(BAND_RDIAG,"yellow");
$donnée->SetFillColor("red");
// Set absolute height of activity
$donnée->SetHeight(16);
$graph->Add($donnée);
}
// ... and display it
$graph->Stroke();
?> |


 Répondre avec citation


Partager