1
2
3
4
5
6
7
8
9
10
11
12
13
14
15
16
17
18
19
20
21
22
23
24
25
26
27
28
29
30
31
32
33
34
35
36
37
38
39
40
41
42
43
44
45
46
47
48
49
50
51
52
53
54
55
56
57
58
59
60
61
62
63
64
65
66
67
68
69
70
71
|
import pandas as pd
import matplotlib.pyplot as plt
from choix_et_lecture_fichier import *
# Choix du fichier à ouvrir
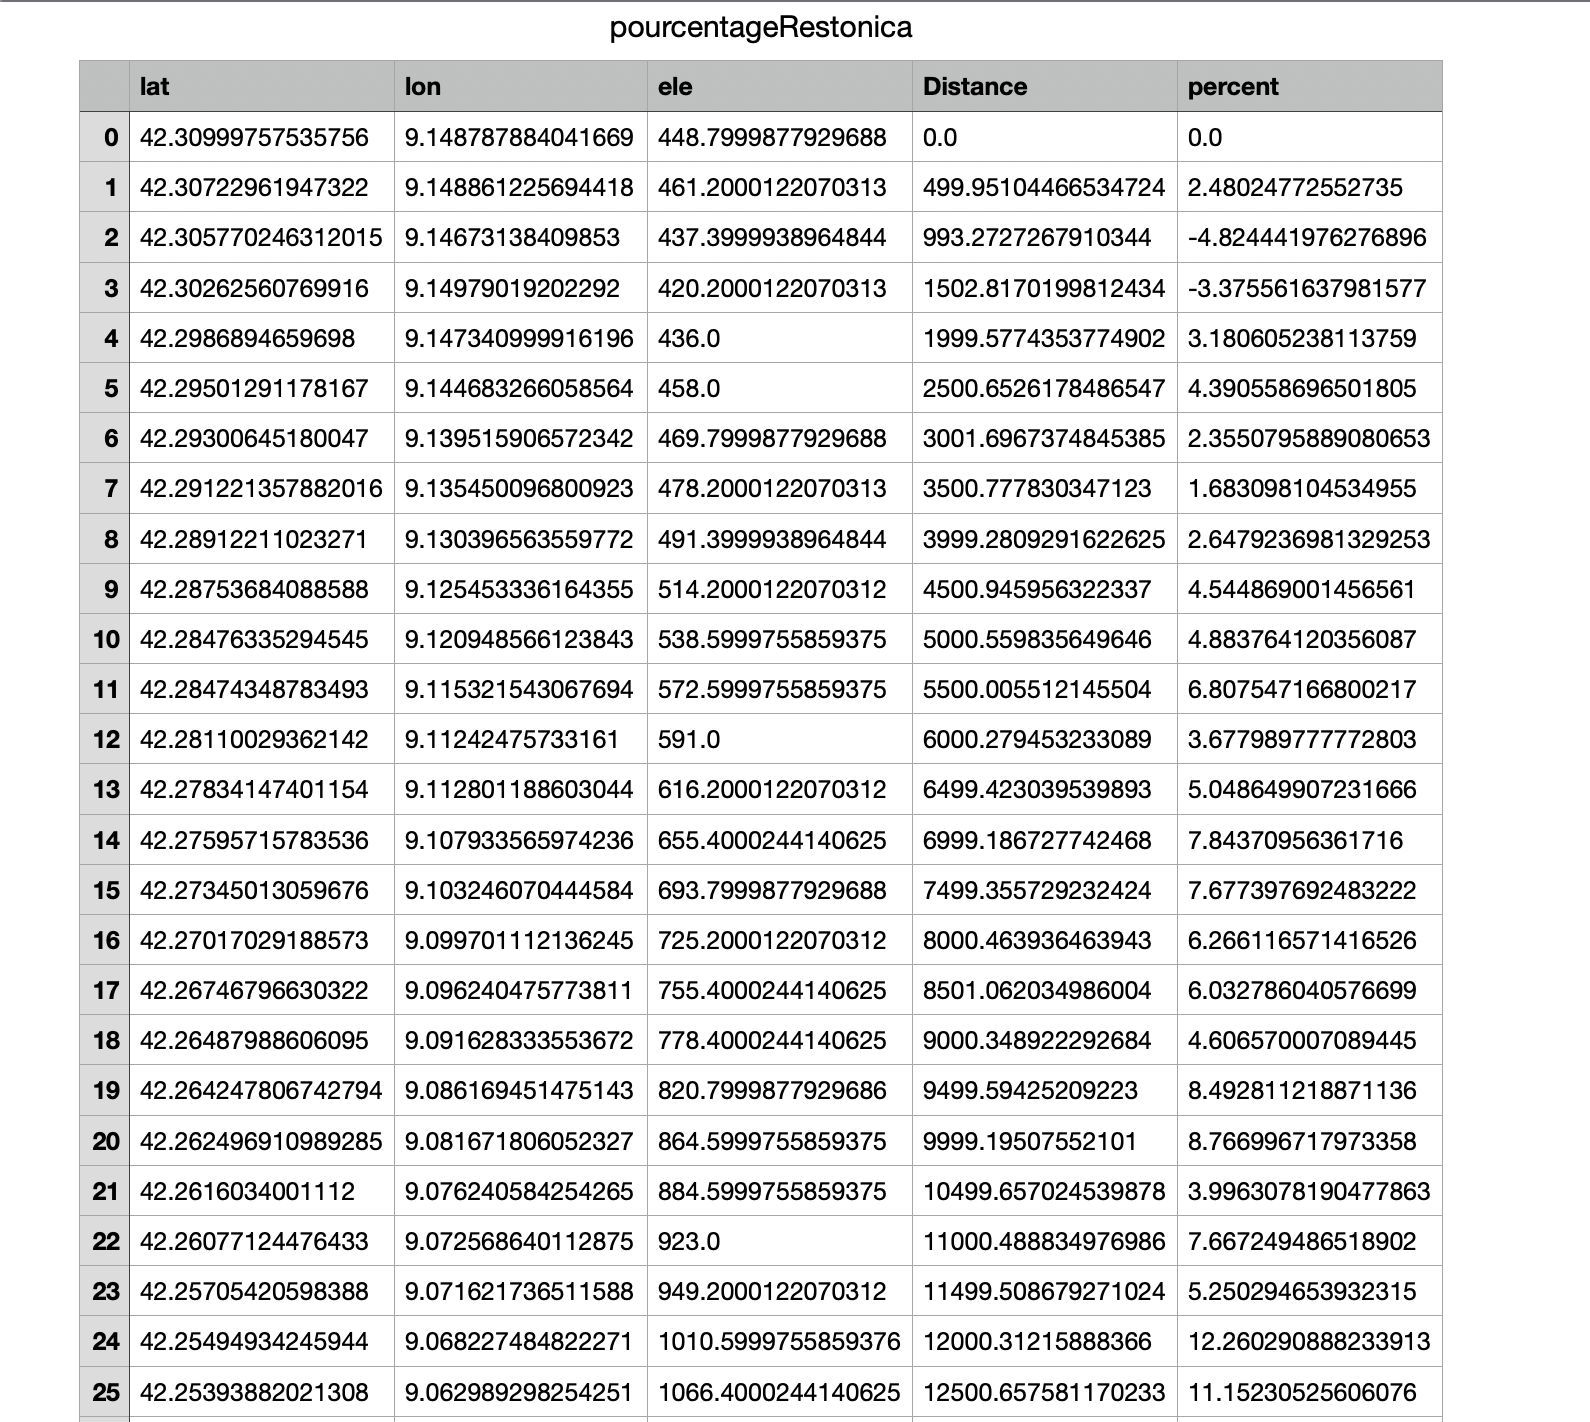
fi = choixDuFichier() # Fichier pourcentageRestonica.csv
pourcentage= pd.read_csv(fi) # Création de la DataFrame
lignes = len(pourcentage) # nombres de lignes de la dataframe
#### Définition du premier polygone
x0 = 0
y0 = 0
x1 = pourcentage.iloc[1, 4]
y1 = pourcentage.iloc[0, 3]
y2 = pourcentage.iloc[1, 3]
A = [x0, x0, x1, x1, x0]
B = [y0, y1, y2, y0, y0]
z = pourcentage.iloc[1, 5] # Défini le pourcentage sur 500 m
fig=plt.figure(figsize=(15, 8))
#### itération sur la DataFrame pour créer tous les polygones
for i in range(0, (lignes-1)) :
xi = pourcentage.iloc[i, 4]
x2 = pourcentage.iloc[(i+1), 4]
yi = pourcentage.iloc[i, 3]
y2 = pourcentage.iloc[(i+1), 3]
z = pourcentage.iloc[(i+1), 5]
A = [xi, xi, x2, x2, xi]
B = [y0, yi, y2, y0, y0]
# Définition de la couleur du pourcentage
u = ''
if z <= 5:
u = ('green')
elif z <= 8:
u = 'blue'
elif z <= 10:
u = 'red'
elif z <= 15:
u = 'black'
elif z > 15:
u = 'sienna'
plt.title("PROFIL DE LA MONTEE DE LA RESTONICA") # titre du Graphe
labels = str(round(z, 2)) # Arrondie du pourcentage
ax=plt.fill(A, B, facecolor= u, edgecolor='black') # Remplissage du polygone
plt.text(xi+125, y1/2, labels + '%', rotation=90, va='center', color='white') # position du pourcentage à l'intérieur du polygone
distance = pourcentage['Distance'] # Définition du label de l'axe X
elevation = pourcentage['ele'] # Définition du label de l'axe Y
x = distance
y = elevation
plt.plot(x, y, color='red', linestyle='solid', label='Profil Restonica') # Traçage du profil général
plt.xlabel('Distance')
plt.xticks(rotation=45)
plt.ylabel('elevation')
plt.show()
plt.close() |


 Répondre avec citation
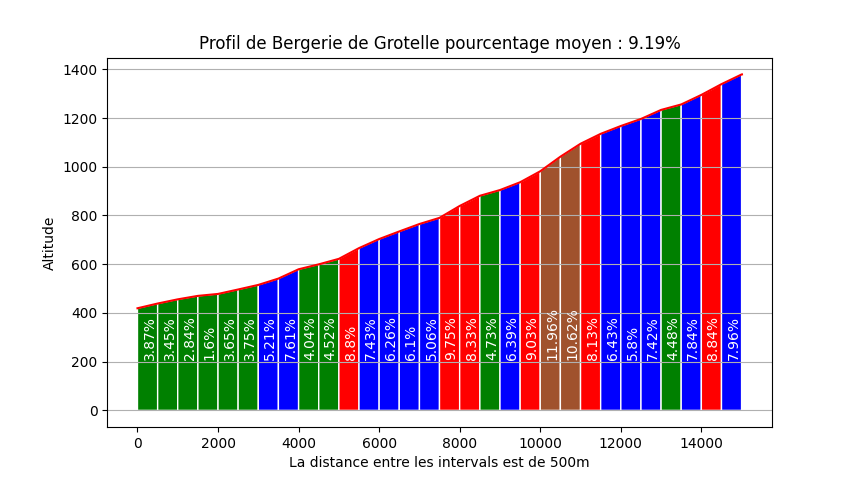

Partager