Bonjour,
Je rencontre quelques difficultés, j'essaye de faire un graph en fonction de données contenues dans une table.
[FONCTIONNEL]
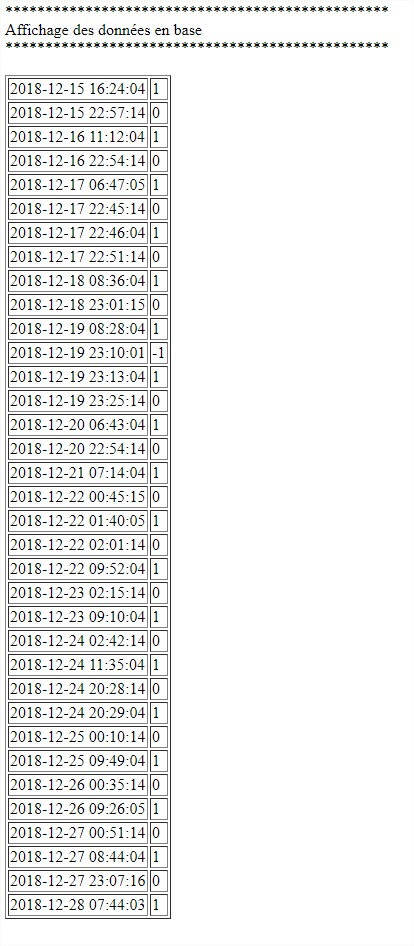
Dans un premier temps j'ai fait une petite page qui me permet d'afficher ma table pour vérifier que j'arrivais à le faire
Code : Sélectionner tout - Visualiser dans une fenêtre à part
1
2
3
4
5
6
7
8
9
10
11
12
13
14
15
16
17
18
19
20
21
22
23
24
25
26
27
28
29
30
31
32
33
34
35
36
37
38
39
40
41
42
43
44
45
46
47 <html> <head> <title> </title> </head> <body> <?php echo "************************************************<br/>"; echo "Affichage des données en base <br/>"; echo "************************************************<br/>"; echo " <br/>"; $dsn = 'mysql:host=127.0.0.1;dbname=DB;port=3306;charset=utf8'; // Création et test de la connexion try { $pdo = new PDO($dsn,'LOGIN','PWD'); } catch (PDOException $exception) { mail('MAIL', 'PDOException', $exception->getMessage()); exit('Erreur de connexion à la base de données'); } // Requête pour tester la connexion $query = $pdo->query("SELECT * FROM `MA_TABLE`"); $resultat = $query->fetchAll(); //Afficher le résultat dans un tableau print("<table border=\"1\">"); foreach ($resultat as $key => $variable) { print("<tr>"); print("<td>".$resultat[$key]['temps']."</td>"); print("<td>".$resultat[$key]['ping']."</td>"); } print("</table>"); ?> </body> </html>
Jusque la pas de problème.
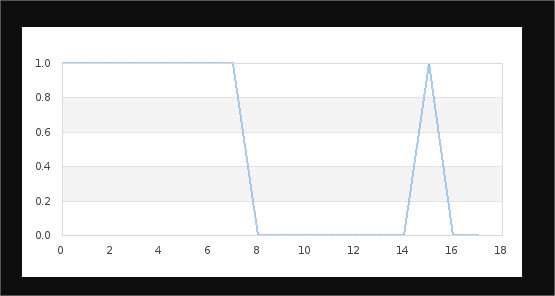
Dans un second temps j'ai installé un pluggin JPGraphic
Avec lequel j'ai joué et j'ai réussi à sortir un graph mais avec des valeurs fixes
Code : Sélectionner tout - Visualiser dans une fenêtre à part
1
2
3
4
5
6
7
8
9
10
11
12
13
14
15
16
17
18
19
20
21
22
23
24
25
26
27
28
29
30
31
32
33
34 <?php // content="text/plain; charset=utf-8" require_once ('/var/www/html/jpgraph/src/jpgraph.php'); require_once ('/var/www/html/jpgraph/src/jpgraph_line.php'); // Some (random) data $ydata = array(1,1,1,1,1,1,1,1,0,0,0,0,0,0,0,1,0,0); // Size of the overall graph $width=500; $height=250; // Create the graph and set a scale. // These two calls are always required $graph = new Graph($width,$height); $graph->SetScale('intlin'); // Create the linear plot $lineplot=new LinePlot($ydata); // Add the plot to the graph $graph->Add($lineplot); // Display the graph $graph->Stroke(); ?>
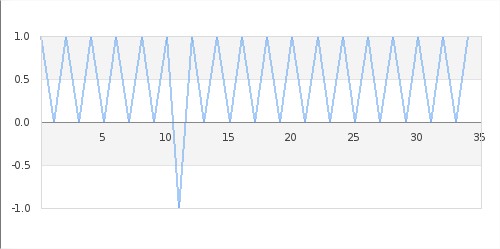
[FIN DU FONCTIONNEL]
La ou ca se corse c'est quand j'essaye d'intégrer les 2 ensembles ....
J'ai tenté ca :
Code : Sélectionner tout - Visualiser dans une fenêtre à part
1
2
3
4
5
6
7
8
9
10
11
12
13
14
15
16
17
18
19
20
21
22
23
24
25
26
27
28
29
30
31
32
33
34
35
36
37
38
39
40
41
42
43
44
45
46
47
48
49
50
51
52
53
54
55
56
57
58
59
60
61
62 <?php // content="text/plain; charset=utf-8" require_once ('/var/www/html/jpgraph/src/jpgraph.php'); require_once ('/var/www/html/jpgraph/src/jpgraph_line.php'); $dsn = 'mysql:host=127.0.0.1;dbname=DB;port=3306;charset=utf8'; // Création et test de la connexion try { $pdo = new PDO($dsn,'LOGIN','PWD'); } catch (PDOException $exception) { mail('MAIL', 'PDOException', $exception->getMessage()); exit('Erreur de connexion à la base de données'); } // Requête pour tester la connexion $query = $pdo->query("SELECT ping FROM `MA_TABLE`"); $resultat = $query->fetchAll(); // Some (random) data //$ydata = array(1,1,1,1,1,1,1,1,0,0,0,0,0,0,0,1,0,0); // Size of the overall graph $width=500; $height=250; // Create the graph and set a scale. // These two calls are always required $graph = new Graph($width,$height); $graph->SetScale('intlin'); foreach ($resultat as $key => $variable) { // Create the linear plot $lineplot=new LinePlot($resultat[$key]['ping']); // Add the plot to the graph $graph->Add($lineplot); } // Display the graph $graph->Stroke(); ?>
Et là c'est la cata ...
Au cas ou :
PHP 7
MariaDB
JPGraph 4.2.6
PS : J'ai hésiter à poster directement ds JPGraph mais je pense avoir plus de réponse ici
Partager