1
2
3
4
5
6
7
8
9
10
11
12
13
14
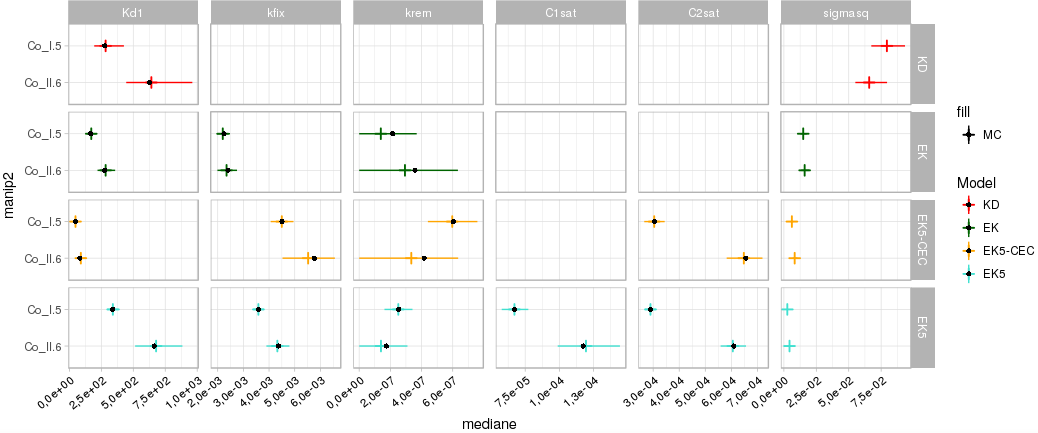
| A <- ggplot(prediction) +
aes(x =manip2 , y=mediane, ymin = X_2.5, ymax=X_97.5, colour=Model2, group=Model2)+
geom_pointrange(shape=3, size=0.50, show.legend = T) +
geom_point(mapping=aes(x=manip2, y = estimation, fill="Fits"), color="black", shape=16, size=1.5,show.legend = T)+
facet_grid(Model2 ~ parametre2 , scales = "free")+
scale_y_continuous(labels=function(x) formatC(x, format="e", digits = 1, decimal.mark =","))+
scale_color_manual("Model",values = c("red", "darkgreen","orange", "turquoise") )+
scale_fill_manual("MC", values = c("black"))+
coord_flip() +
theme_light()+
theme(panel.spacing.x = unit(0.65, "lines"))+
theme(axis.text.x=element_text(angle=40, hjust=1, vjust=1, size=9, color="black"))
A |


 Répondre avec citation
Partager