1
2
3
4
5
6
7
8
9
10
11
12
13
14
15
16
17
18
19
20
21
22
23
24
25
26
27
28
29
30
31
32
33
34
35
36
37
| clear
figure
txtg = uicontrol('Style','text',...
'Position',[200 280 50 20],...
'String','0');
txtpot = uicontrol('Style','text',...
'Position',[350 250 50 20],...
'String','0');
R=1;% Rayon poulie du panneau
r=0.5;% Rayon poulie du potentiomètre
h1=plot([0 0],[0 0]);
hold on
h2=plot([0 0],[0 0]);
circle([1-r,0],r,100);
circle([-2-R,0],R,100);
line([-3 0.5],[1 0.5])
line([-3 0.5],[-1 -0.5])
axis([-4 4 -4 4])
axis equal
hold on
grid
n=0;
for alphag=0:-0.01:-2*pi
n=n+1;
alpha=alphag*R/r;
potentiometre(n)=mod(fix(abs(alpha*1023/(2*pi))),1023);
set(txtpot,'string',num2str(potentiometre(n)))
panneau(n)=alphag*180/pi;
set(txtg,'string',num2str(panneau(n)))
Xp=[0.5 0.5+r*cos(alpha)];
Yp=[0 r*sin(alpha)];
set(h1,'Xdata',Xp,'Ydata',Yp)
Xg=[-3 -3+R*cos(alphag)];
Yg=[0 R*sin(alphag)];
set(h2,'Xdata',Xg,'Ydata',Yg)
pause(0.1)
end |


 Répondre avec citation

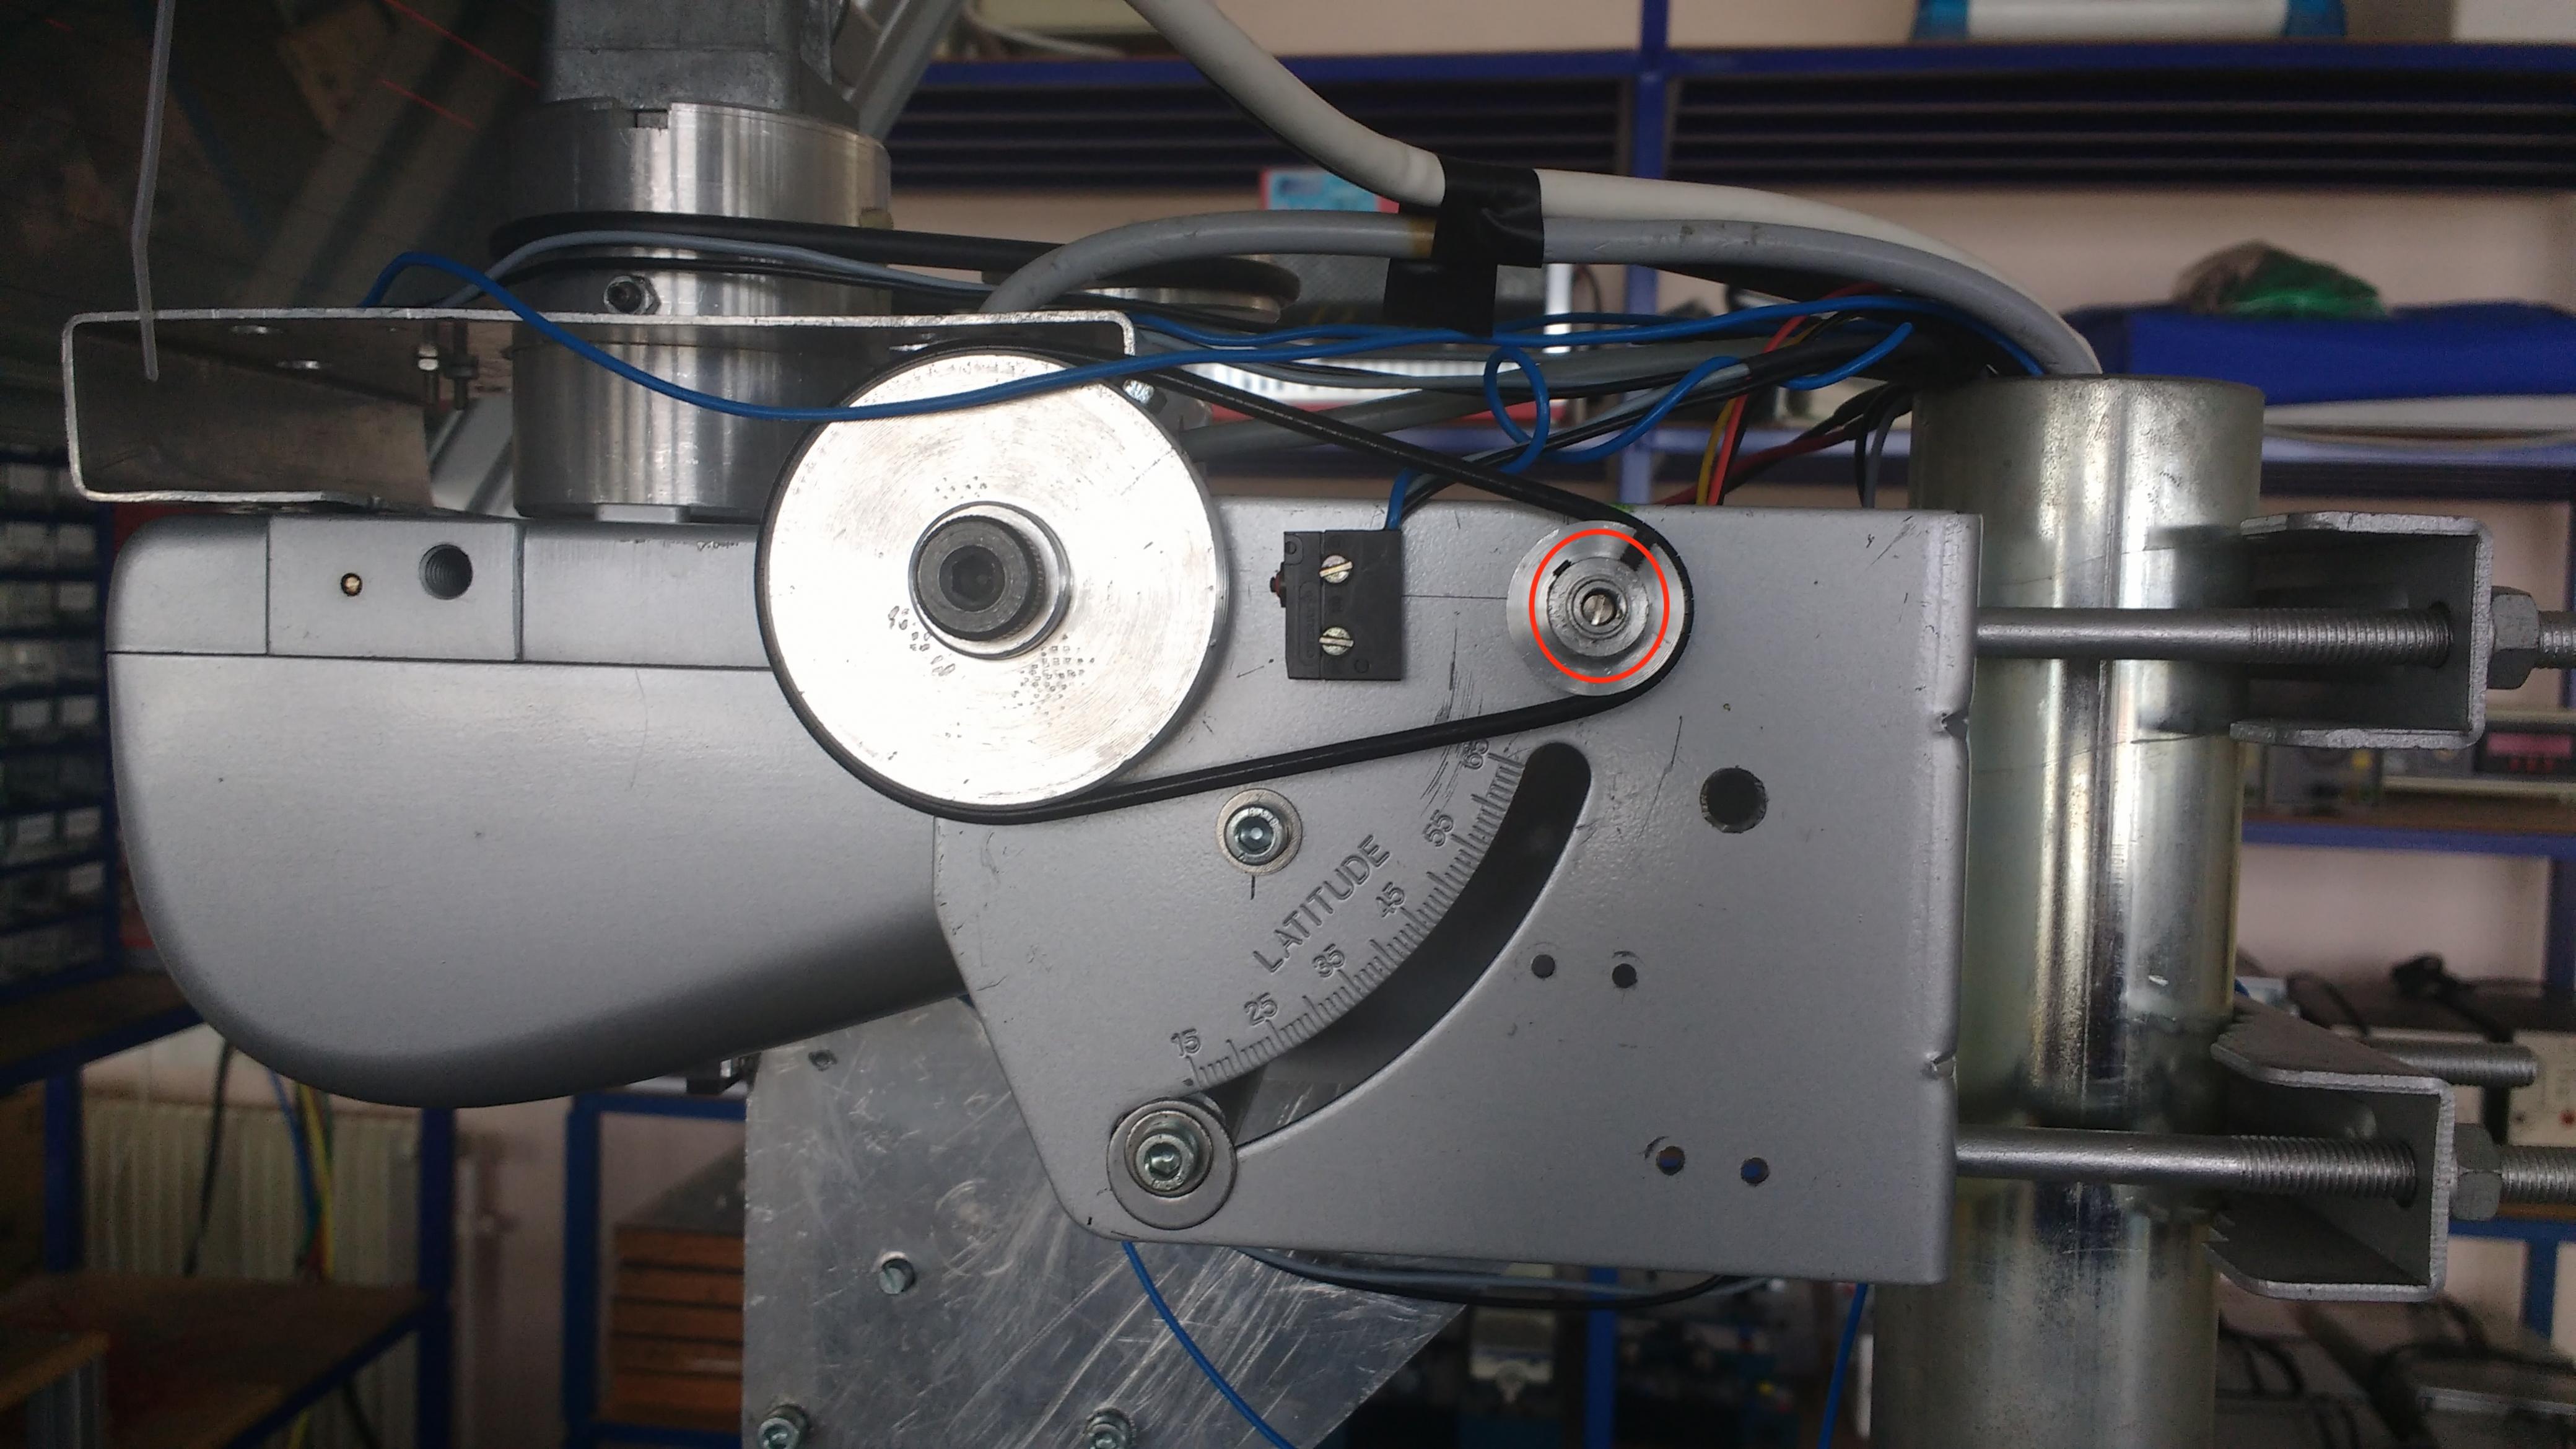 Je bouge un panneau solaire en élévation ( de haut en bas ) et j'aimerai acquérir la position du panneau en degrés grâce à ce potentiomètre et à cette poulie-courroie.

Partager