Bonjour à toutes et à tous,
Je m'inscris à l'instant sur ce beau forum (qui m'a énormément aidé d'ailleurs) pour vous soumettre un problème qui me fait m'arracher les cheveux tant il parait si simple... mais il est si compliqué pourtant ! J'espère de tout coeur que vous pourrez me porter main forte !
Alors voilà, j'ai programmé sous vb net (avec visual studio), un graphique en barres alimenté par une requete SQL, donc j'ai tout paramétré (selon moi) comme il le faut, néanmoins je fais face à un grand problème:
Je voudrais tout simplement aligner mes séries pour que les barres s'affichent les unes derrières les autres et non l'une sur l'autre (dans le cas du stacked column...)
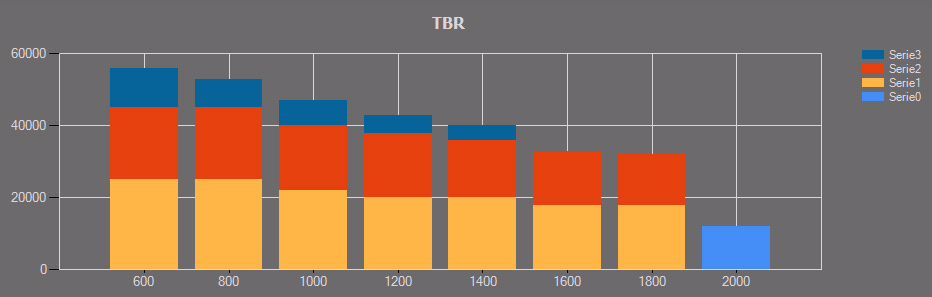
Donc j'ai essayé d'abord de paramétrer mes séries en "stacked column", et comme je le dis plus haut, mes séries s'empilent et ne se superpose pas, ce qui fait que là où je devrais avoir en valeur max 25000 par exemple et bien j'ai plus de 50000 car les valeurs s'additionnent et ne se superposent pas... Voici le résultat:
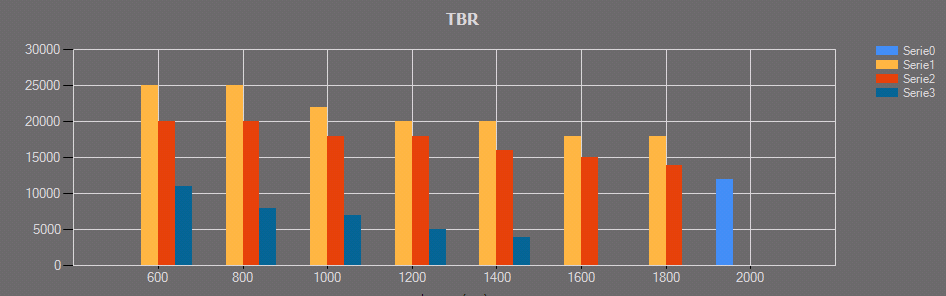
J'ai également essayé avec la méthode "column" et "range column" mais impossible pour moi de régler les intervalles et la superposition (comme sur Excel quoi)... donc là même problème différent, les séries sont les unes à côté des autres... Voici le résultat:
Voici le code (dans l'état, il est paramétré pour obtenir le résultat column, donc celui juste au dessus):
Donc voilà, j'espère avoir été assez clair dans mes propos et que vous comprenez ma demande... pour résumer... je voudrais superposer mes séries et non les additionner ou les séparer... donc soit en fixant la stacked column à ma valeur max et non sur une addition de valeurs, soit en superposer mes séries en column...
Code : Sélectionner tout - Visualiser dans une fenêtre à part
1
2
3
4
5
6
7
8
9
10
11
12
13
14
15
16
17
18
19
20
21
22
23
24
25
26
27
28
29
30
31
32
33
34
35
36
37
38
39
40
41
42
43
44
45
46
47
48
49
50
51
52
53
54
55
56
57
58
59
60
61
62
63
64
65
66
67
68
69
70
71
72
73
74
75
76
77
78
79
80
81
82
83
84
85
86
87
88
89
90
91
92
93
94
95
96
97
98
99
100
101
102
103
104
105
106
107
108
109
110
111
112
113
114
115
116
117
118
119
120
121
122
123
124
125
126
127
128
129
130
131
132
133
134
135
136
137
138
139
140
141
142
143
144
145
146
147
148
149
150
151
152
153
154
155
156
157
158
159
160
161
162
163
164
165
166
167
168
169
170
171
172
173
174
175
176
177
178
179
180
181
182
183
184
185
186
187
188
189
190
191
192
193
194
195
196
197
198
199
200
201
202
203
204
205
206
207
208
209
210
211
212
213
214
215
216
217
218
219
220
221
222
223
224
225
226
227
228
229
230
231
232
233
234
235
236
237
238
239
240
241
242
243
244
245
246
247
248
249
250
251
252
253
254
255
256
257
258
259
260
261
262
263
264
265
266
267
268
269
270
271
272
273
274
275
276
277
278
279
280
281
282
283
284
285
286
287
288
289
290
291
292
293
294
295
296
297
298
299
300
301
302
303
304
305
306
307
308
309
310
311
312
313
314
315
316
317
318
319
320
321
322
323
324
325
326
327
328
329
330
331
332
333
334
335
336
337
338
339
340 Public Function AfficherGraph(TypeEquip As String) Dim TABLE_VALEURS As New Data.DataTable("RECHERCHES") Dim Requette As String = "" Dim Valeur As Long Dim SommeValeur As Long = 0 Dim ChartArea As New ChartArea() ABAQUES.CH_LIM.ChartAreas.Add(ChartArea) Requette = "SELECT * FROM MOTEUR_CARAC, MOTEUR_LIMITE WHERE MOTEUR_CARAC.ID_MOT = MOTEUR_LIMITE.ID_MOT AND MOTEUR_LIMITE.TYPE_LIM = '" & TypeEquip & "' ORDER BY MOTEUR_CARAC.ID_MOT DESC" cmd = New SqlCommand(Requette, ConSMG_TOOLS) : If ConSMG_TOOLS.State = ConnectionState.Closed Then ConSMG_TOOLS.Open() : myDA = New SqlDataAdapter(cmd) myDataSet = New DataSet() : myDA.Fill(myDataSet, "MyTable") : TABLE_VALEURS = myDataSet.Tables("MyTable") : ConSMG_TOOLS.Close() For i = 0 To TABLE_VALEURS.Rows.Count - 1 ABAQUES.CH_LIM.Series.Add("Serie" & i) ABAQUES.CH_LIM.Series("Serie" & i).ChartArea = ChartArea.Name ABAQUES.CH_LIM.Series("Serie" & i).ChartType = SeriesChartType.Column ABAQUES.CH_LIM.Series("Serie" & i).IsXValueIndexed = True 'Verif colonne 400 For j = 0 To TABLE_VALEURS.Rows.Count - 1 Valeur = TABLE_VALEURS.Rows(j).Item("LAR400") SommeValeur = SommeValeur + Valeur Next j If SommeValeur <> 0 Then 'If TABLE_VALEURS.Rows(i).Item("LAR400") <> 0 Then Dim p As New DataPoint p.XValue = 400 p.YValues = {TABLE_VALEURS.Rows(i).Item("LAR400")} ABAQUES.CH_LIM.Series("Serie" & i).Points.Add(p) End If 'End If SommeValeur = 0 'Verif colonne 600 For j = 0 To TABLE_VALEURS.Rows.Count - 1 Valeur = TABLE_VALEURS.Rows(j).Item("LAR600") SommeValeur = SommeValeur + Valeur Next j If SommeValeur <> 0 Then 'If TABLE_VALEURS.Rows(i).Item("LAR600") <> 0 Then Dim p As New DataPoint p.XValue = 600 p.YValues = {TABLE_VALEURS.Rows(i).Item("LAR600")} ABAQUES.CH_LIM.Series("Serie" & i).Points.Add(p) End If 'End If SommeValeur = 0 'Verif colonne 800 For j = 0 To TABLE_VALEURS.Rows.Count - 1 Valeur = TABLE_VALEURS.Rows(j).Item("LAR800") SommeValeur = SommeValeur + Valeur Next j If SommeValeur <> 0 Then 'If TABLE_VALEURS.Rows(i).Item("LAR800") <> 0 Then Dim p As New DataPoint p.XValue = 800 p.YValues = {TABLE_VALEURS.Rows(i).Item("LAR800")} ABAQUES.CH_LIM.Series("Serie" & i).Points.Add(p) End If 'End If SommeValeur = 0 'Verif colonne 1000 For j = 0 To TABLE_VALEURS.Rows.Count - 1 Valeur = TABLE_VALEURS.Rows(j).Item("LAR1000") SommeValeur = SommeValeur + Valeur Next j If SommeValeur <> 0 Then 'If TABLE_VALEURS.Rows(i).Item("LAR1000") <> 0 Then Dim p As New DataPoint p.XValue = 1000 p.YValues = {TABLE_VALEURS.Rows(i).Item("LAR1000")} ABAQUES.CH_LIM.Series("Serie" & i).Points.Add(p) End If 'End If SommeValeur = 0 'Verif colonne 1200 For j = 0 To TABLE_VALEURS.Rows.Count - 1 Valeur = TABLE_VALEURS.Rows(j).Item("LAR1200") SommeValeur = SommeValeur + Valeur Next j If SommeValeur <> 0 Then 'If TABLE_VALEURS.Rows(i).Item("LAR1200") <> 0 Then Dim p As New DataPoint p.XValue = 1200 p.YValues = {TABLE_VALEURS.Rows(i).Item("LAR1200")} ABAQUES.CH_LIM.Series("Serie" & i).Points.Add(p) End If 'End If SommeValeur = 0 'Verif colonne 1400 For j = 0 To TABLE_VALEURS.Rows.Count - 1 Valeur = TABLE_VALEURS.Rows(j).Item("LAR1400") SommeValeur = SommeValeur + Valeur Next j If SommeValeur <> 0 Then 'If TABLE_VALEURS.Rows(i).Item("LAR1400") <> 0 Then Dim p As New DataPoint p.XValue = 1400 p.YValues = {TABLE_VALEURS.Rows(i).Item("LAR1400")} ABAQUES.CH_LIM.Series("Serie" & i).Points.Add(p) End If 'End If SommeValeur = 0 'Verif colonne 1500 For j = 0 To TABLE_VALEURS.Rows.Count - 1 Valeur = TABLE_VALEURS.Rows(j).Item("LAR1500") SommeValeur = SommeValeur + Valeur Next j If SommeValeur <> 0 Then 'If TABLE_VALEURS.Rows(i).Item("LAR1500") <> 0 Then Dim p As New DataPoint p.XValue = 1500 p.YValues = {TABLE_VALEURS.Rows(i).Item("LAR1500")} ABAQUES.CH_LIM.Series("Serie" & i).Points.Add(p) End If 'End If SommeValeur = 0 'Verif colonne 1600 For j = 0 To TABLE_VALEURS.Rows.Count - 1 Valeur = TABLE_VALEURS.Rows(j).Item("LAR1600") SommeValeur = SommeValeur + Valeur Next j If SommeValeur <> 0 Then 'If TABLE_VALEURS.Rows(i).Item("LAR1600") <> 0 Then Dim p As New DataPoint p.XValue = 1600 p.YValues = {TABLE_VALEURS.Rows(i).Item("LAR1600")} ABAQUES.CH_LIM.Series("Serie" & i).Points.Add(p) End If 'End If SommeValeur = 0 'Verif colonne 1800 For j = 0 To TABLE_VALEURS.Rows.Count - 1 Valeur = TABLE_VALEURS.Rows(j).Item("LAR1800") SommeValeur = SommeValeur + Valeur Next j If SommeValeur <> 0 Then 'If TABLE_VALEURS.Rows(i).Item("LAR1800") <> 0 Then Dim p As New DataPoint p.XValue = 1800 p.YValues = {TABLE_VALEURS.Rows(i).Item("LAR1800")} ABAQUES.CH_LIM.Series("Serie" & i).Points.Add(p) End If 'End If SommeValeur = 0 'Verif colonne 2000 For j = 0 To TABLE_VALEURS.Rows.Count - 1 Valeur = TABLE_VALEURS.Rows(j).Item("LAR2000") SommeValeur = SommeValeur + Valeur Next j If SommeValeur <> 0 Then 'If TABLE_VALEURS.Rows(i).Item("LAR2000") <> 0 Then Dim p As New DataPoint p.XValue = 2000 p.YValues = {TABLE_VALEURS.Rows(i).Item("LAR2000")} ABAQUES.CH_LIM.Series("Serie" & i).Points.Add(p) End If 'End If SommeValeur = 0 'Verif colonne 2200 For j = 0 To TABLE_VALEURS.Rows.Count - 1 Valeur = TABLE_VALEURS.Rows(j).Item("LAR2200") SommeValeur = SommeValeur + Valeur Next j If SommeValeur <> 0 Then 'If TABLE_VALEURS.Rows(i).Item("LAR2200") <> 0 Then Dim p As New DataPoint p.XValue = 2200 p.YValues = {TABLE_VALEURS.Rows(i).Item("LAR2200")} ABAQUES.CH_LIM.Series("Serie" & i).Points.Add(p) End If 'End If SommeValeur = 0 'Verif colonne 2400 For j = 0 To TABLE_VALEURS.Rows.Count - 1 Valeur = TABLE_VALEURS.Rows(j).Item("LAR2400") SommeValeur = SommeValeur + Valeur Next j If SommeValeur <> 0 Then 'If TABLE_VALEURS.Rows(i).Item("LAR2400") <> 0 Then Dim p As New DataPoint p.XValue = 2400 p.YValues = {TABLE_VALEURS.Rows(i).Item("LAR2400")} ABAQUES.CH_LIM.Series("Serie" & i).Points.Add(p) End If 'End If SommeValeur = 0 'Verif colonne 2600 For j = 0 To TABLE_VALEURS.Rows.Count - 1 Valeur = TABLE_VALEURS.Rows(j).Item("LAR2600") SommeValeur = SommeValeur + Valeur Next j If SommeValeur <> 0 Then 'If TABLE_VALEURS.Rows(i).Item("LAR2600") <> 0 Then Dim p As New DataPoint p.XValue = 2600 p.YValues = {TABLE_VALEURS.Rows(i).Item("LAR2600")} ABAQUES.CH_LIM.Series("Serie" & i).Points.Add(p) End If 'End If SommeValeur = 0 'Verif colonne 2800 For j = 0 To TABLE_VALEURS.Rows.Count - 1 Valeur = TABLE_VALEURS.Rows(j).Item("LAR2800") SommeValeur = SommeValeur + Valeur Next j If SommeValeur <> 0 Then 'If TABLE_VALEURS.Rows(i).Item("LAR2800") <> 0 Then Dim p As New DataPoint p.XValue = 2800 p.YValues = {TABLE_VALEURS.Rows(i).Item("LAR2800")} ABAQUES.CH_LIM.Series("Serie" & i).Points.Add(p) End If 'End If SommeValeur = 0 'Verif colonne 3000 For j = 0 To TABLE_VALEURS.Rows.Count - 1 Valeur = TABLE_VALEURS.Rows(j).Item("LAR3000") SommeValeur = SommeValeur + Valeur Next j If SommeValeur <> 0 Then 'If TABLE_VALEURS.Rows(i).Item("LAR3000") <> 0 Then Dim p As New DataPoint p.XValue = 3000 p.YValues = {TABLE_VALEURS.Rows(i).Item("LAR3000")} ABAQUES.CH_LIM.Series("Serie" & i).Points.Add(p) End If 'End If SommeValeur = 0 'ABAQUES.CH_LIM.Series("Serie" & i)("StackedGroupName") = "Group1" 'ABAQUES.CH_LIM.Series("Serie" & i).Name = TABLE_VALEURS.Rows(i).Item("REF_MOT") Next i ABAQUES.CH_LIM.BackColor = Color.DimGray ABAQUES.CH_LIM.ChartAreas("ChartArea1").BackColor = Color.DimGray ABAQUES.CH_LIM.ChartAreas("ChartArea1").AxisX.LineColor = Color.LightGray ABAQUES.CH_LIM.ChartAreas("ChartArea1").AxisY.LineColor = Color.LightGray ABAQUES.CH_LIM.ChartAreas("ChartArea1").AxisX.MajorGrid.LineColor = Color.LightGray ABAQUES.CH_LIM.ChartAreas("ChartArea1").AxisX.MajorGrid.Interval = 0 ABAQUES.CH_LIM.ChartAreas("ChartArea1").AxisY.MajorGrid.LineColor = Color.LightGray ABAQUES.CH_LIM.ChartAreas("ChartArea1").AxisY.MajorGrid.Interval = 0 ABAQUES.CH_LIM.ChartAreas("ChartArea1").AxisX.LabelStyle.ForeColor = Color.LightGray ABAQUES.CH_LIM.ChartAreas("ChartArea1").AxisY.LabelStyle.ForeColor = Color.LightGray ABAQUES.CH_LIM.ChartAreas("ChartArea1").AxisX.Title = "Largeur (mm)" ABAQUES.CH_LIM.ChartAreas("ChartArea1").AxisY.Title = "Longueur (mm)" Dim Legende As New Legend Legende.LegendStyle = LegendStyle.Column ABAQUES.CH_LIM.Legends.Add(Legende) ABAQUES.CH_LIM.Legends(0).BackColor = Color.DimGray ABAQUES.CH_LIM.Legends(0).BorderColor = Color.DimGray ABAQUES.CH_LIM.Legends(0).ForeColor = Color.LightGray Return ("") End Function
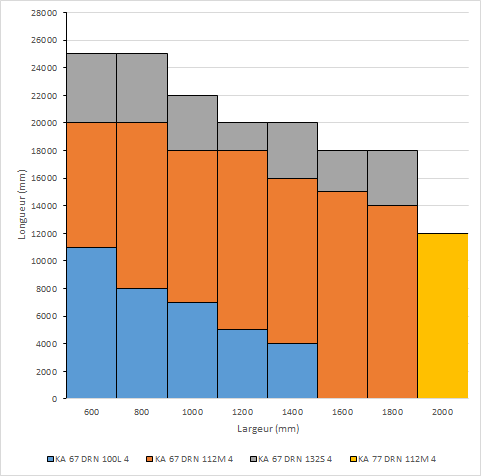
Pour être encore plus précis voici le résultat (fait par Excel en deux clics...) du résultat voulu:
Si vous avez des questions ou des détails, n'hésitez pas à me les demander, j'espère de tout coeur que vous pourrez m'aider et je vous en remercie d'avance, car ce graphique est entrain de me sortir par les yeux car je ne comprend pas comment quelque chose qui parait si simple devient soudain si difficile...
Cordialement, Gav" !
Partager