1
2
3
4
5
6
7
8
9
10
11
12
13
14
15
16
17
18
19
20
21
22
23
24
25
26
27
| #!/usr/bin/python3
# -*- coding: utf-8 -*-
import numpy as np
import matplotlib.pyplot as plt
import scipy.optimize as op
def f(x):
"""Fonction de Rosenbrock a deux variables"""
return (1 - x[0])**2 + (x[1] - x[0]**2)**2
def main():
x1, x2 = np.meshgrid(np.linspace(0,1.5,201),np.linspace(-0.5,1.5,201))
solsimplexe_cg = op.fmin_cg(f, (0.0,0.0), retall=True)
_, path_cg = solsimplexe_cg
solsimplexe = op.fmin(f, (0.0,0.0), retall=True)
_, path = solsimplexe
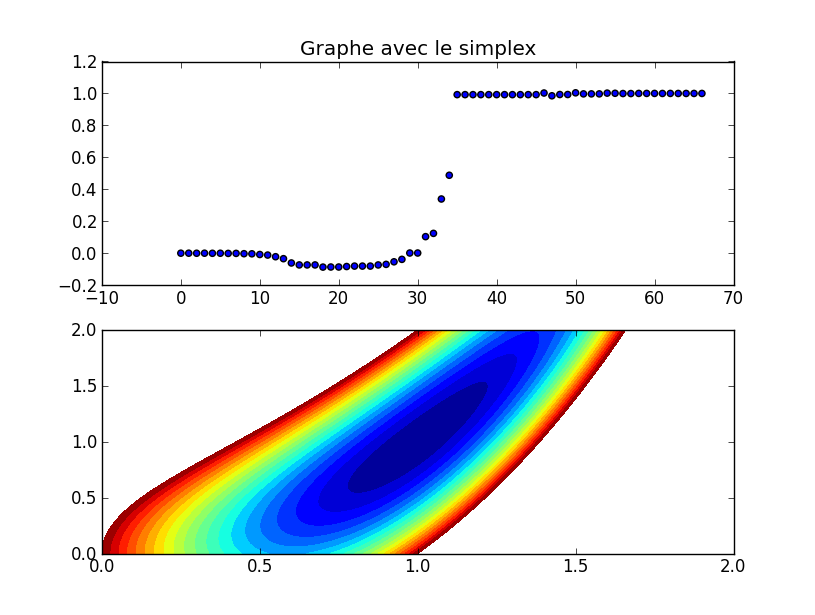
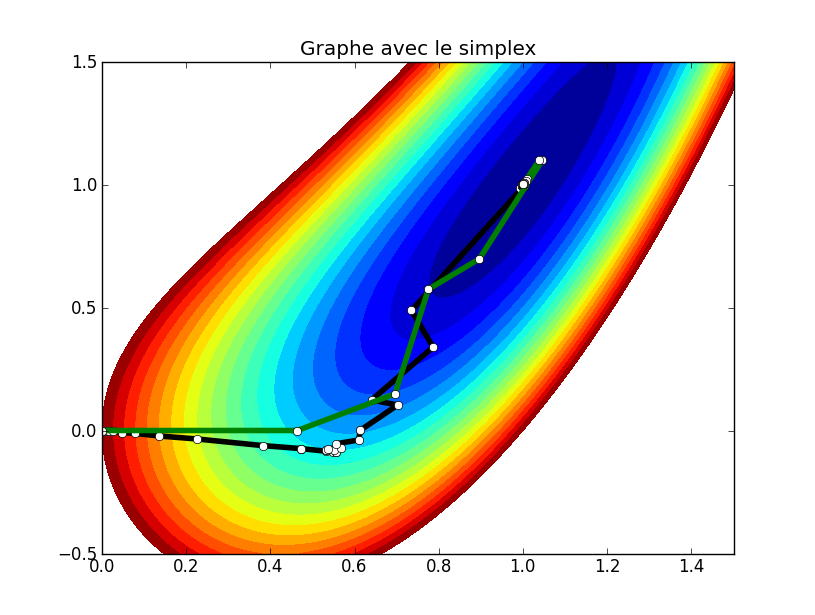
plt.title('Graphe avec le simplex')
plt.contourf(x1, x2, f([x1,x2]), np.linspace(0,1,21))
plt.plot(*zip(*path), lw=4, color="black", marker="o", markerfacecolor="white")
plt.plot(*zip(*path_cg), lw=4, color="green", marker="o", markerfacecolor="white")
plt.show()
if __name__ == '__main__':
main() |


 Répondre avec citation


Partager