1
2
3
4
5
6
7
8
9
10
11
12
13
14
15
16
17
18
19
20
21
22
23
24
25
26
27
28
29
30
| clc;
fig = figure;
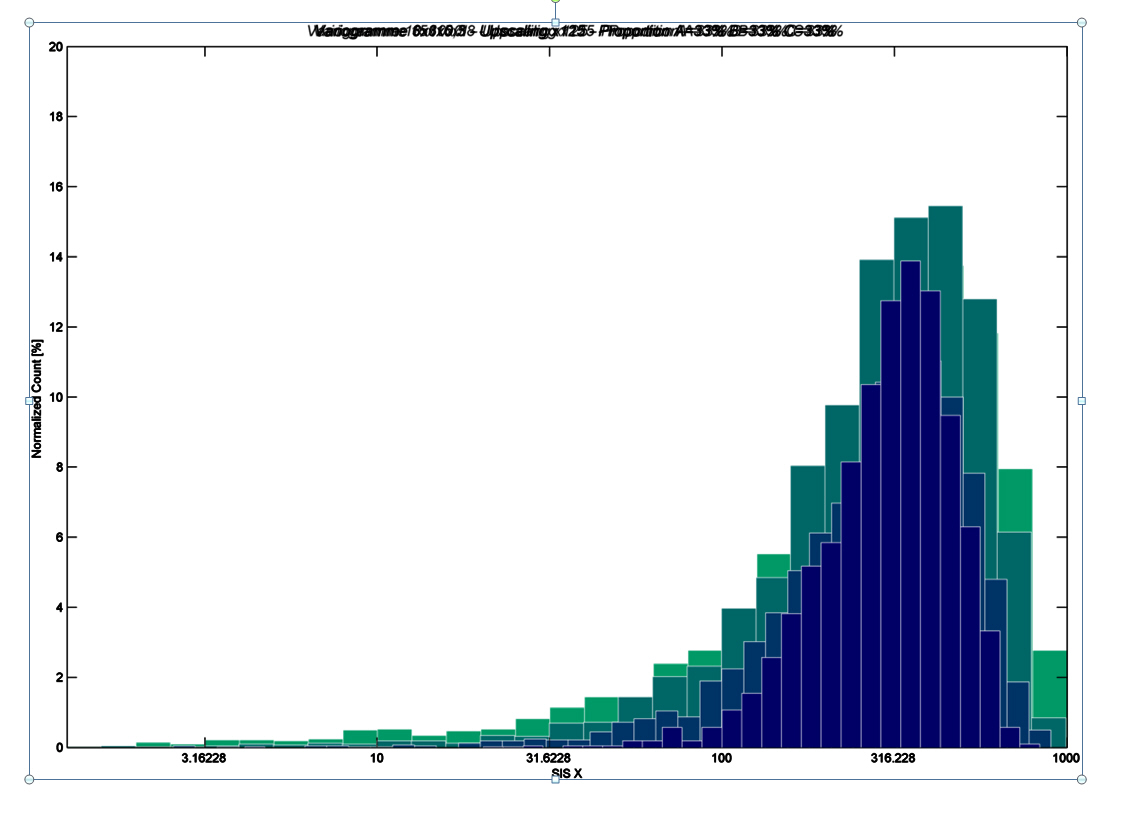
q='SIS X'; %Nom abscisse
r='Variogramme 3x3x0,3 - Upscaling x125 - Proportion A=33% B=33% C=33%'; %Titre
x=log10(SISX); %Hist de ma donnée
numberOfBins = 40;
[counts, binValues] = hist(x, numberOfBins);
normalizedCounts = 100 * counts / sum(counts);
a=bar(binValues, normalizedCounts, 'barwidth', 1);
xlabel(q);
title(r,'FontAngle','italic','FontSize',12.5);
ylabel('Normalized Count [%]');
ylim([0 20]);
xlim([0.1 3]);
set(gca,'XTickLabel',10.^str2num(get(gca,'XTickLabel')));
h = findobj(gca,'Type','patch');
set(h,'FaceColor',[0.1 0 0.9],'EdgeColor','w'); %Couleur de l'histo
set(gca, 'Color', 'none');% Couleur de fond
set(fig, 'units', 'inches', 'position', [ 5 5 15 10]); %Dimension fenêtre de sortie
export_fig 'Images\x125\Vario 3303\SISX.png' -transparent -m1; %Export de mon image |


 Répondre avec citation
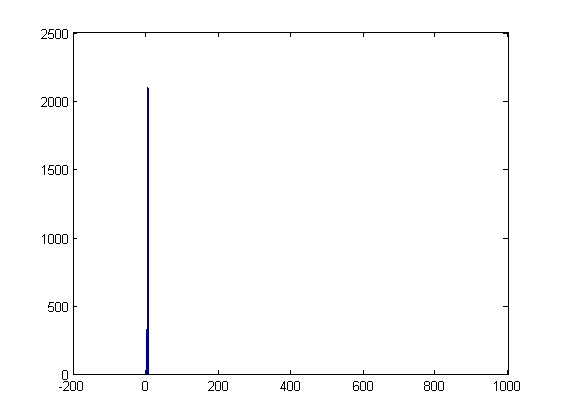
![Nom : Histo_normal[1].jpg
Affichages : 434
Taille : 19,1 Ko](https://www.developpez.net/forums/attachments/p146977d1401111285/environnements-developpement/matlab/questionnement-histogramme/histo_normal-1-.jpg/)
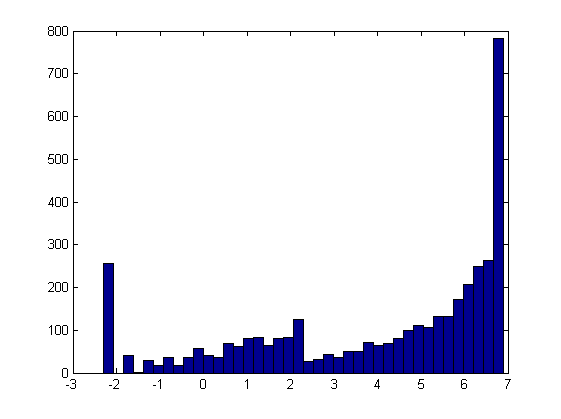
![Nom : Histo_log[1].jpg
Affichages : 388
Taille : 16,9 Ko](https://www.developpez.net/forums/attachments/p146976d1401111173/environnements-developpement/matlab/questionnement-histogramme/histo_log-1-.jpg/)


Partager