1
2
3
4
5
6
7
8
9
10
11
12
13
14
15
16
17
18
19
20
21
22
23
24
25
26
27
28
29
30
31
32
33
34
35
36
|
Public Const nb_samples_max As Integer = 4000
Public xch1(nb_samples_max) As Single
Private Sub Form1_Load(sender As Object, e As EventArgs) Handles MyBase.Load
Dim chartArea1 As New ChartArea() ' Create an Chart Area
Dim sigch1 As String = "Signal ch1" ' signal
chartArea1.Name = sigch1
Chart1.Legends.Clear()
Chart1.ChartAreas.Add(chartArea1)
Chart1.ChartAreas(chartArea1.Name).BackColor = Color.LightGray
Chart1.Series.Add(sigch1) ' display signal
Chart1.Series(sigch1).ChartArea = chartArea1.Name 'serie is displayed in chartArea1
Chart1.Series(sigch1).Color = Color.Red
Chart1.Series(sigch1).ChartType = SeriesChartType.FastLine ' draw mode line
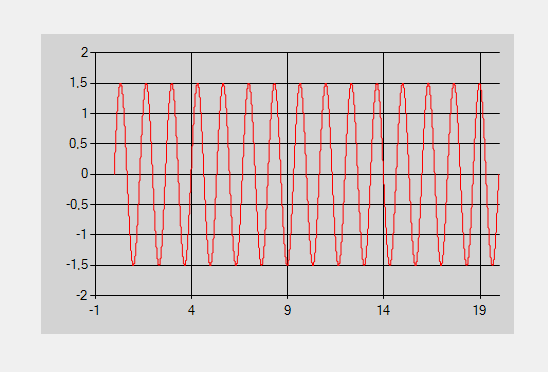
        Chart1.ChartAreas(0).AxisX.Maximum = 20                     ' 20 ms
        Chart1.ChartAreas(0).AxisX.Minimum = 0
        Chart1.ChartAreas(0).AxisY.Maximum = 1.5                    ' 1.5 V
        Chart1.ChartAreas(0).AxisY.Minimum = -1.5
Chart1.ChartAreas(0).AxisY.Title = "CH1 SA"
Chart1.ChartAreas(0).AxisX.Title = "Time (ms)"
Chart1.Series(0).XValueType = ChartValueType.Int32
Chart1.Series(0).YValueType = ChartValueType.Single
Chart1.ChartAreas(0).Position = New ElementPosition(0, 0, 500, 200)
Chart1.ChartAreas(0).BackColor = Color.LightGray
Dim t As Single
Dim nsamples = 4000
Dim acq_per_local As Single = 0.000005
For i = 0 To nsamples
t = 1000 * i * acq_per_local
xch1(i) = 1.5 * Sin(2 * Math.PI * t * 0.75)
Chart1.Series(0).Points.AddXY(t, xch1(i))
Next
End Sub |


 Répondre avec citation


Partager