1
2
3
4
5
6
7
8
9
10
11
12
13
14
15
16
17
18
19
20
21
22
23
24
25
26
27
28
29
30
31
32
33
34
35
36
37
38
39
40
41
42
43
44
45
46
47
48
49
50
51
52
53
54
55
56
57
58
59
60
61
62
63
64
| import pandas as pd
import numpy as np
import matplotlib.pyplot as plt
from math import log10
from numpy import polyfit
import numpy.polynomial.polynomial as poly
import scipy
from scipy import stats
data=pd.read_excel('data.xlsx',sheet_name='Sheet2',index=False,dtype={'Ra': float})
print(data)
x=np.log10(data['Ra'].values)
y1=np.log10(data['Nu_top'].values)
y2=np.log10(data['Nu_bottom'].values)
x2=np.log10(data['Ra'].head(11).values)
y4=np.log10(data['Nu_top'].head(11).values)
x3=np.log10(data['Ra'].tail(4).values)
y5=np.log10(data['Nu_top'].tail(4).values)
plt.xscale('log')
plt.yscale('log')
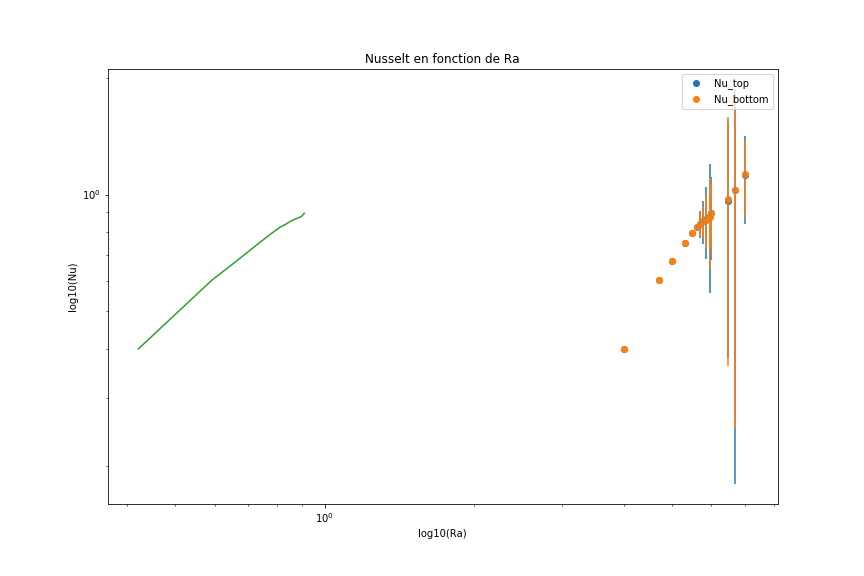
plt.scatter(x, y1, label='Nu_top')
plt.scatter(x, y2, label='Nu_bottom')
plt.errorbar(x, y1 , yerr=data['Ecart type top'].values, linestyle="None")
plt.errorbar(x, y2 , yerr=data['Ecart type bot'].values, linestyle="None")
"""a=np.ones(10, dtype=np.float)
weights = np.insert(a,0,1E10)"""
lr = scipy.stats.linregress(x2, y4)
print(lr)
plt.plot(lr[0]*x2+lr[1],y4)
"""
coefs = poly.polyfit(x2, y4, 1)
print(coefs)
ffit = poly.polyval(x2, coefs)
plt.plot(x2, ffit, label='fit: b=%5.3f, a=%5.3f' % tuple(coefs))
absError = ffit - x2
SE = np.square(absError) # squared errors
MSE = np.mean(SE) # mean squared errors
RMSE = np.sqrt(MSE) # Root Mean Squared Error, RMSE
Rsquared = 1.0 - (np.var(absError) / np.var(x2))
print('RMSE:', RMSE)
print('R-squared:', Rsquared)
print()
print('Predicted value at x=0:', ffit[0])
print()
coefs = poly.polyfit(x3, y5, 1)
ffit = poly.polyval(x3, coefs)
plt.plot(x3, ffit, label='fit: b=%5.3f, a=%5.3f' % tuple(coefs))
"""
plt.grid
plt.title("Nusselt en fonction de Ra")
plt.xlabel('log10(Ra)')
plt.ylabel('log10(Nu)')
plt.legend()
plt.show() |


 Répondre avec citation
Partager