1
2
3
4
5
6
7
8
9
10
11
12
13
14
15
16
17
18
19
20
21
22
23
24
25
26
27
28
| while True:
sample, timestamp= inlet.pull_sample()
#print(sample)
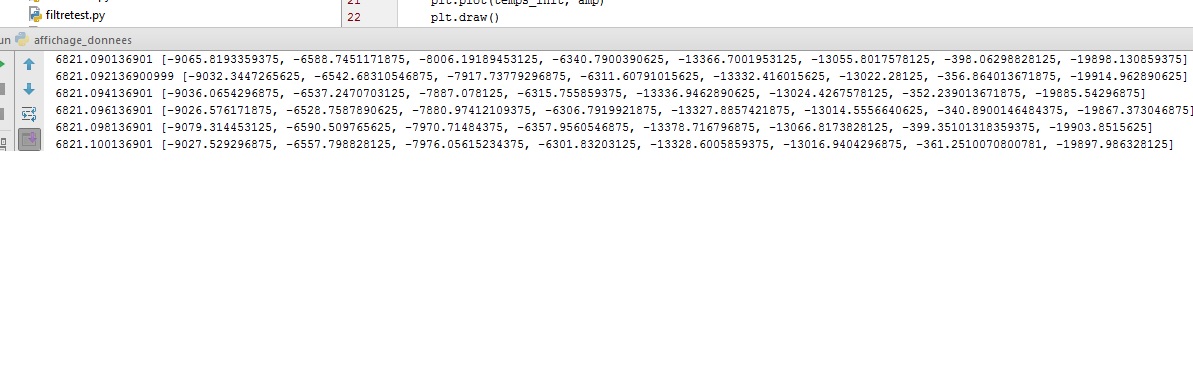
C1 = sample[0:1] # Affichage du canal 1 (1:2, 2:3, 3:4, 4:5, 5:6, 6:7, 7:8)
#print(C1)
temps = timestamp
temps_init.append(temps)
xar.append(C1)
# plt.plot(temps_init,xar)
# plt.draw()
# plt.pause(0.05) # figure updated and displayed, and the GUI event loop will run during the pause
# plt.clf() # clear the current figure
#bandpass
Fs = 500
wp = [0.2,0.5]
ws = [0.1,0.6]
Rp = 1 # passband maximum loss (gpass)
As = 100 # stoppand min attenuation (gstop)
b, a = fd.iirdesign(wp, ws, Rp, As, ftype='butter')
w, H = signal.freqz(b, a) # filter response
#plt.plot(w, H)
t = temps_init
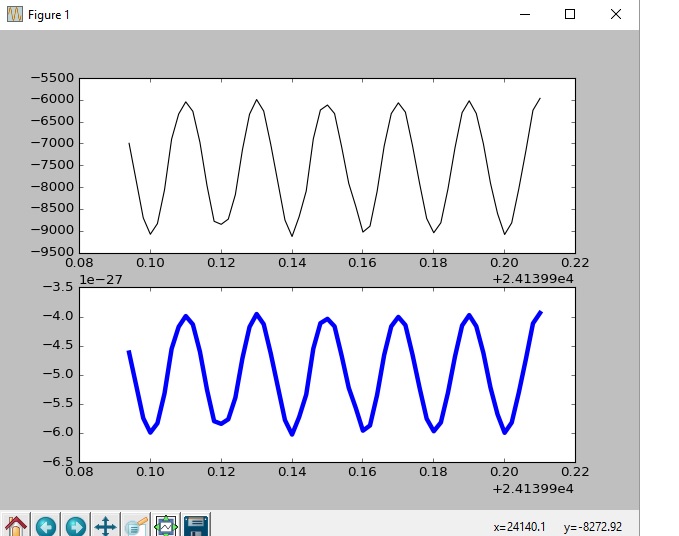
y = signal.filtfilt(b, a, xar)
plt.plot(t, y)
plt.draw()
plt.pause(0.05) # figure updated and displayed, and the GUI event loop will run during the pause
plt.clf() # clear the current figurel |


 Répondre avec citation


Partager