1
2
3
4
5
6
7
8
9
10
11
12
13
14
15
16
17
18
19
20
21
22
23
24
25
26
27
28
29
30
31
32
33
34
35
36
37
38
39
40
41
42
43
44
45
46
47
48
49
50
51
52
53
54
55
56
57
58
59
60
61
62
63
64
65
66
67
68
69
70
71
72
73
74
75
76
77
78
79
80
81
82
83
84
85
86
87
88
89
| <!DOCTYPE HTML PUBLIC >
<html>
<head>
<meta http-equiv="Content-Type" content="text/html; charset=UTF-8">
<script type="text/javascript" src="flow_graph/jquery.js"></script>
<script type="text/javascript" src="smoothie.js"></script>
<script type="text/javascript" src="jquery-1.7.2.min.js"></script>
<script type="text/javascript">
function AJAX_Chart ()
{
var request = new XMLHttpRequest();
request.onreadystatechange = function()
{
if (this.readyState == 4)
{
if (this.status == 200)
{
if (this.responseXML != null)
{
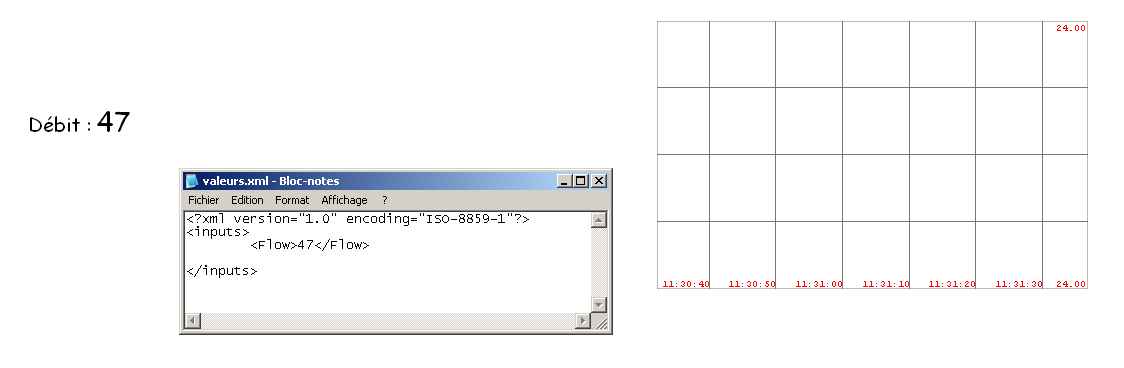
var flow = this.responseXML.getElementsByTagName('Flow')[0].childNodes[0].nodeValue;
var line_flow = new TimeSeries();
setInterval(function() {
line_flow.append(new Date().getTime(), flow);
}, 1200);
var chart_FF = new SmoothieChart({
millisPerPixel:150,
grid:{fillStyle:'#ffffff',
sharpLines:true,
millisPerLine:10000,
verticalSections:4
},
labels:{fillStyle:'#ff0000'},
timestampFormatter:SmoothieChart.timeFormatter
}),
canvas = document.getElementById('Chart_Flow'),
series = new TimeSeries();
chart_FF.addTimeSeries(line_flow, {
lineWidth: 1.9,
strokeStyle: 'rgba(0,128,255,0.81)'
});
chart_FF.streamTo(document.getElementById("Chart_Flow"), 1000 );
}
}
}
}
request.open("GET", "valeurs.xml" , true);
request.send(null);
}
function AJAX_Measure ()
{
var request = new XMLHttpRequest();
request.onreadystatechange = function()
{
if (this.readyState == 4)
{
if (this.status == 200)
{
if (this.responseXML != null)
{
document.getElementById("débit").innerHTML = this.responseXML.getElementsByTagName('Flow')[0].childNodes[0].nodeValue;
}
}
}
}
request.open("GET", "valeurs.xml" , true);
request.send(null);
setTimeout('AJAX_Measure()',1000);
}
</script>
</head>
<body onload="AJAX_Chart();AJAX_Measure()" >
<div id="container">
<canvas id="Chart_Flow" width="431" height="268" style="position: absolute; left: 694px; top: 227px; z-index:64;" >
</canvas>
<div id="wb_Text15" style="position:absolute;left:66px;top:308px;width:380px;height:38px;z-index:16;text-align:left;">
<span style="color:#000000;font-family:'Comic Sans MS';font-size:20px;">Débit : </span>
<span style="color:#000000;font-family:'Comic Sans MS';font-size:27px;" id="débit"><strong>...</strong></span> |


 Répondre avec citation


Partager