1
2
3
4
5
6
7
8
9
10
11
12
13
14
15
16
17
18
19
20
21
22
23
24
25
26
27
28
29
30
31
32
33
|
# Charger
library(ggplot2)
library(tidyverse) # pour les fonctions fct_reorder / stringr
library(plyr) # pour la fonction dplyr
# création du dataframe
Num_etablissement <- rep ( c(1,2,3,2),10)
Champ <- rep ( c("Grand champ","Petit champ"),40)
Ecart_PDS_chp <-rnorm(40, mean=1, sd= 6)
df1 <- data.frame(Num_etablissement,Champ, Ecart_PDS_chp)
# création du dataframe modifié et calcul des quantiles
annot_data <- df1 %>%
group_by(Champ) %>%
dplyr::mutate(n = n(), centres = n_distinct(Num_etablissement) , q1=round(quantile(Ecart_PDS_chp, 0.25),1),
q3=round(quantile(Ecart_PDS_chp, 0.75),1),
med=round(median(Ecart_PDS_chp, na.rm=TRUE),1) ) %>%
ungroup() %>%
mutate(x_label = paste0(Champ, "\nn=", n, "\n", centres, " centres" ))
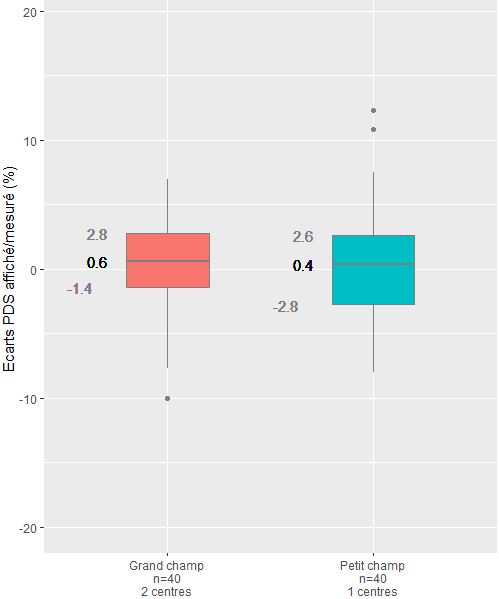
# création du graphique
g1 <- ggplot(annot_data , aes( x = x_label, y = Ecart_PDS_chp, fill=Champ)) +
geom_boxplot(colour="grey50", width=0.4) +
xlab("")+ylab("Ecarts PDS affiché/mesuré (%)")+
coord_cartesian ( ylim= c(-20,20))+
# AJOUT DE MES VALEURS :
geom_text(data=annot_data, aes(x=x_label, y=med, label = med), hjust=4)+
geom_text(data=annot_data, aes(x=x_label, y=q1, label = q1), hjust=4, colour="grey50")+
geom_text(data=annot_data, aes(x=x_label, y=q3, label = q3), hjust=4, colour="grey50")
g1 |


 Répondre avec citation
Partager