1
2
3
4
5
6
7
8
9
10
11
12
13
14
15
16
17
18
19
20
21
22
23
24
25
26
27
28
29
30
31
32
33
34
35
36
37
38
39
40
41
42
43
44
45
46
47
48
49
50
51
52
53
54
55
56
57
58
59
60
61
62
63
64
65
66
67
68
69
70
71
72
73
74
75
76
77
78
79
80
81
82
83
84
85
86
87
88
89
90
91
92
93
94
95
96
97
98
99
| { ======================================================================= }
// Uses ... , ComObj, Excel2000 ;
procedure TForm2.Button5Click(Sender: TObject);
Var
XLApp : Variant;
MonGraph : Variant;
n1, n2 : Integer ; // Numéros des colonnes des données
Nom : string ; // Nom de la feuille
XAxe, YAxe : Variant ;
{ type_chart : array[0..10] of Cardinal =
( xl3DPie,xl3DColumn,xlLine,xlLineMarkers ,xl3DPie , xlPie ,
xlXYScatter ,xl3DArea,xlArea ,xlDoughnut,xlRadar ); }
begin
// Si Excel est ouvert on le ferme
if not VarIsEmpty(XLApp ) then
begin
XLApp.DisplayAlerts := CheckBox1.Checked ; // Pas d'affichage de sauvegarde
XLApp.quit;
XLApp := unassigned;
end;
// Ouverture d'Excel
if VarIsEmpty(XLApp) then
begin
XLApp := CreateOLEObject('Excel.application');
XLApp.Visible:=True
end;
// Ajout d'une feuille
XLApp.Workbooks.Add ; // [XLWBatWorksheet]
// Nommage de la feuille
XLApp.Workbooks[1].Worksheets[1].Name := 'Test Graphique' ;
// Sélection de la feuille 1
XLApp.Workbooks[1].Worksheets[1].select;
Nom := XLApp.WorkBooks[1].WorkSheets[1].name;
Form2.Caption := nom ;
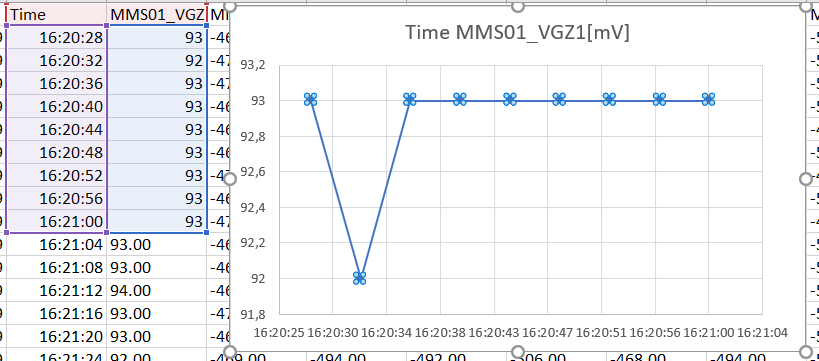
// Génération des données
n1 := 2 ; // Colonne B
n2 := 4 ; // Colonne D
XlApp.cells[ 1 , n1] := '16:20:28' ; XlApp.cells[ 1 , n2] := '93' ;
XlApp.cells[ 2 , n1] := '16:20:32' ; XlApp.cells[ 2 , n2] := '92' ;
XlApp.cells[ 3 , n1] := '16:20:36' ; XlApp.cells[ 3 , n2] := '93' ;
XlApp.cells[ 4 , n1] := '16:20:40' ; XlApp.cells[ 4 , n2] := '93' ;
XlApp.cells[ 5 , n1] := '16:20:44' ; XlApp.cells[ 5 , n2] := '93' ;
XlApp.cells[ 6 , n1] := '16:20:48' ; XlApp.cells[ 6 , n2] := '93' ;
XlApp.cells[ 7 , n1] := '16:20:52' ; XlApp.cells[ 7 , n2] := '93' ;
XlApp.cells[ 8 , n1] := '16:20:56' ; XlApp.cells[ 8 , n2] := '93' ;
XlApp.cells[ 9 , n1] := '16:21:00' ; XlApp.cells[ 9 , n2] := '93' ;
XlApp.cells[ 10 , n1] := '16:21:04' ; XlApp.cells[ 10 , n2] := '93' ;
XlApp.cells[ 11 , n1] := '16:21:08' ; XlApp.cells[ 11 , n2] := '93' ;
XlApp.cells[ 12 , n1] := '16:21:12' ; XlApp.cells[ 12 , n2] := '93' ;
XlApp.cells[ 13 , n1] := '16:21:16' ; XlApp.cells[ 13 , n2] := '93' ;
XlApp.cells[ 14 , n1] := '16:21:20' ; XlApp.cells[ 14 , n2] := '93' ;
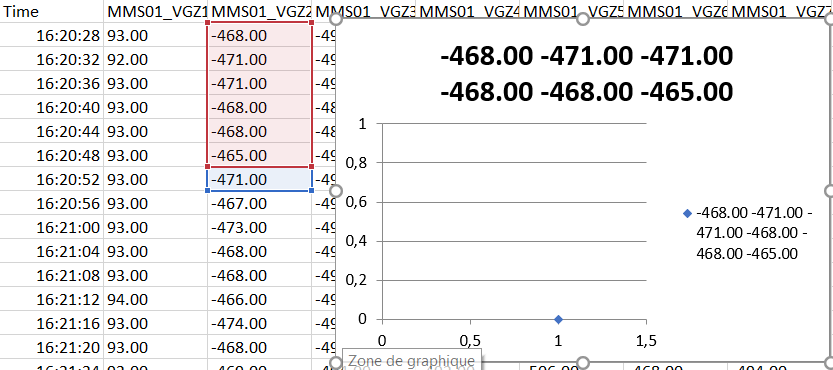
// Sélection des cellules pour le graphique
XAxe:= XLApp.Range['B1','B14'];
YAxe:= XLApp.Range['D1','D14'];
XAxe.Select ; // Si j'enlève cette ligne : plantage sur "MonGraph.HasTitle := true;"
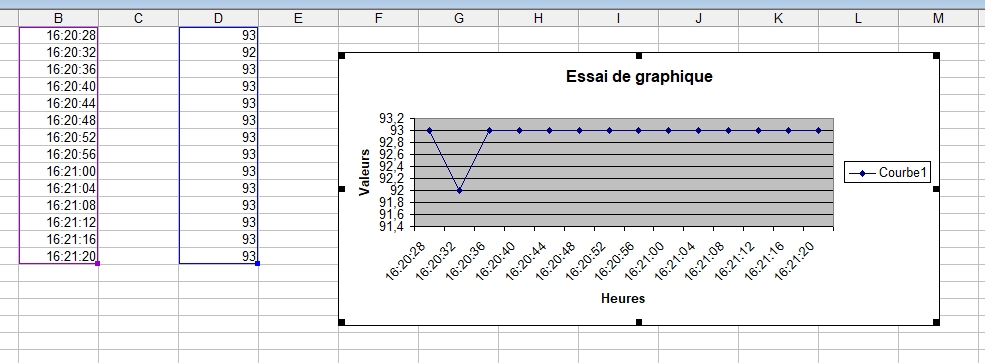
// insertion du graphique
MonGraph := XLApp.Sheets.Add(,,1,xlChart);
// Type de graphique : xlLineMarkers
MonGraph.ChartType:= xlLineMarkers ;
// Titre du graphique
MonGraph.ChartArea.Select ;
MonGraph.HasTitle := true;
MonGraph.ChartTitle.CHARACTERS.TEXT := 'Essai de graphique' ;
// Titre axes des X
MonGraph.Axes(xlCategory, xlPrimary).HasTitle := True ;
MonGraph.Axes(xlCategory, xlPrimary).AxisTitle.Characters.Text := 'Heures' ;
// Titre Axes des Y
MonGraph.Axes(xlValue, xlPrimary).HasTitle := True ;
MonGraph.Axes(xlValue, xlPrimary).AxisTitle.Characters.Text := 'Valeurs' ;
// Sélection des axes
MonGraph.SetSourceData(XLApp.union(XAxe, YAxe),xlColumns);
MonGraph.SeriesCollection(1).XValues:=XAxe;
// Légende de la courbe
MonGraph.SeriesCollection(1).Name := 'Courbe1' ;
// Titre du graphique
MonGraph.Location(xlLocationAsObject,'Test Graphique' );
// Position du graphique sur la feuille
XLApp.ActiveSheet.ChartObjects(1).Top := 20;
XLApp.ActiveSheet.ChartObjects(1).left := 300;
// Quitter Excel ?
if MessageDlg('Fermeture d''Excel ?', mtConfirmation, [mbYes, mbNo], 0) = mrYes Then
begin
if not VarIsEmpty(XLApp ) then
begin
XLApp.DisplayAlerts := CheckBox1.Checked ;
XLApp.quit;
XLApp := unassigned;
end;
End ;
end; |


 Répondre avec citation


Partager