1
2
3
4
5
6
7
8
9
10
11
12
13
14
15
16
17
18
19
20
21
22
23
24
25
26
27
28
29
30
|
# Boucle pour tous les actes
for (cet_acte in unique(RECUEIL$Acte)){
DFacte <- RECUEIL[RECUEIL$Acte==cet_acte,]
# Création de l’HISTOGRAMME:
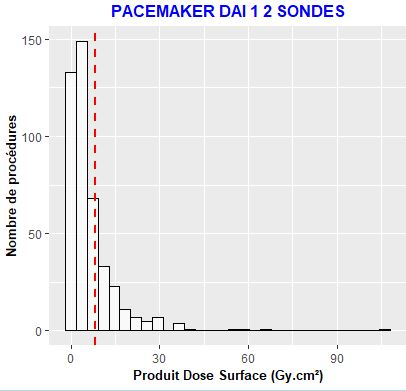
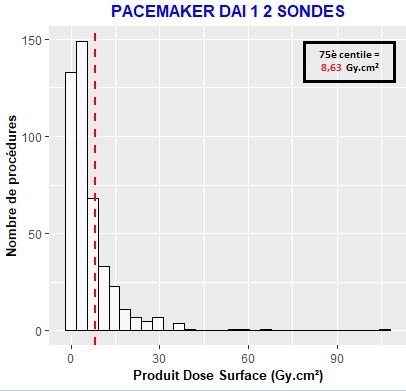
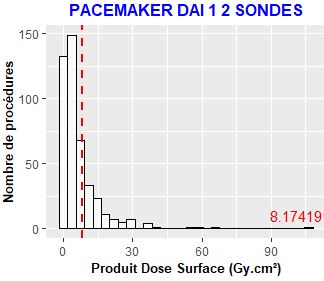
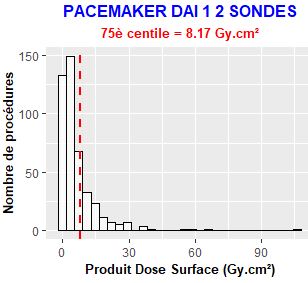
ggplot(DFacte) +
aes(x=PDS_Total_corrigé_Gy.cm2) +
geom_histogram(alpha=0.7, fill="white", color="black", bins=30) +
ggtitle(chartr("_", " " ,cet_acte)) + xlab("Produit Dose Surface (Gy.cm²)") + ylab("Nombre de procédures") +
theme(plot.title = element_text(face="bold", colour = "blue", size = 12, hjust=0.5)) +
theme(axis.title.y = element_text(face="bold", colour = "black", size = 10)) +
theme(axis.title.x = element_text(face="bold", colour = "black", size = 10)) +
geom_vline(aes(xintercept=quantile(PDS_Total_corrigé_Gy.cm2, 0.75)), color="red", linetype="dashed", lwd=1) +
# Sauvegarde du Graphe:
# extraire la spécialité
Spe <- DFacte$Spécialité[1]
ggsave(paste(Spe,paste0(cet_acte,".jpg"), sep="_"), device="jpg")
# Effacer la DataFrame DFacte:
rm(DFacte)
} |


 Répondre avec citation


Partager