1
2
3
4
5
6
7
8
9
10
11
12
13
14
15
16
17
18
19
20
21
22
23
24
25
26
27
28
29
30
31
32
33
34
35
36
37
38
39
40
41
42
43
44
45
46
47
48
49
50
51
52
53
54
55
56
57
58
59
|
<?php
// content="text/plain; charset=utf-8"
session_start ();
require_once ('src/jpgraph.php');
require_once ('src/jpgraph_line.php');
$datay1 = array($_SESSION['test3']);
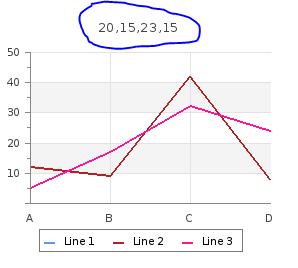
$datay2 = array(12,9,42,8);
$datay3 = array(5,17,32,24);
// Setup the graph
$graph = new Graph(300,250);
$graph->SetScale("textlin");
$theme_class=new UniversalTheme;
$graph->SetTheme($theme_class);
$graph->img->SetAntiAliasing(false);
$graph->title->Set('Filled Y-grid');
$graph->SetBox(false);
$graph->title->Set($_SESSION['test3']);
$graph->SetMargin(40,20,36,63);
$graph->img->SetAntiAliasing();
$graph->yaxis->HideZeroLabel();
$graph->yaxis->HideLine(false);
$graph->yaxis->HideTicks(false,false);
$graph->xgrid->Show();
$graph->xgrid->SetLineStyle("solid");
$graph->xaxis->SetTickLabels(array('A','B','C','D'));
$graph->xgrid->SetColor('#E3E3E3');
// Create the first line
$p1 = new LinePlot($datay1);
$graph->Add($p1);
$p1->SetColor("#6495ED");
$p1->SetLegend('Line 1');
// Create the second line
$p2 = new LinePlot($datay2);
$graph->Add($p2);
$p2->SetColor("#B22222");
$p2->SetLegend('Line 2');
// Create the third line
$p3 = new LinePlot($datay3);
$graph->Add($p3);
$p3->SetColor("#FF1493");
$p3->SetLegend('Line 3');
$graph->legend->SetFrameWeight(1);
// Output line
$graph->Stroke();
?> |


 Répondre avec citation


Partager