1
2
3
4
5
6
7
8
9
10
11
12
13
14
15
16
17
18
19
20
21
22
23
24
25
26
27
28
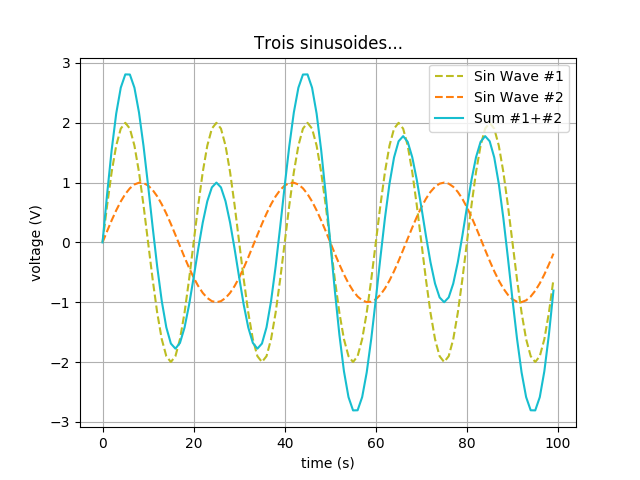
| import math
import matplotlib.pyplot as plt
from operator import add
def make_sin(a=1, ph=0, f=440.0, fe=8000.0, n=100):
omega = 2 * math.pi * f
te = 1.0/fe
zob = omega * te
return [a * math.sin((zob * i) + ph) for i in range(n)]
if __name__ == '__main__':
nbValeurs = 100
x = range(nbValeurs)
y1 = make_sin(a=2, f=50.0, fe=1000.0, n=nbValeurs)
y2 = make_sin(a=1, f=30.0, fe=1000.0, n=nbValeurs)
y3 = map(add, y1, y2) # on additionne les sinusoides ici
plt.plot(x, y1, '--C8', label='Sin Wave #1')
plt.plot(x, y2, '--C1', label='Sin Wave #2')
plt.plot(x, y3, '-C9', label='Sum #1+#2')
plt.xlabel('time (s)')
plt.ylabel('voltage (V)')
plt.title('Trois sinusoides...')
plt.grid(True)
plt.legend()
plt.show() |


 Répondre avec citation


Partager