IdentifiantMot de passe
Loading...
Mot de passe oublié ?Je m'inscris ! (gratuit)
Navigation

Inscrivez-vous gratuitement
pour pouvoir participer, suivre les réponses en temps réel, voter pour les messages, poser vos propres questions et recevoir la newsletter

Tableaux - Graphiques - Images - Flottants Discussion :

Problème de texte qui dépasse de la cellule en utilisant \multirow


Sujet :

Tableaux - Graphiques - Images - Flottants

  1. #1
    Candidat au Club
    Homme Profil pro
    Étudiant
    Inscrit en
    Novembre 2017
    Messages
    2
    Détails du profil
    Informations personnelles :
    Sexe : Homme
    Localisation : France, Loire Atlantique (Pays de la Loire)

    Informations professionnelles :
    Activité : Étudiant

    Informations forums :
    Inscription : Novembre 2017
    Messages : 2
    Points : 2
    Points
    2
    Par défaut Problème de texte qui dépasse de la cellule en utilisant \multirow
    Bonjour à tous,

    Je rédige actuellement un rapport en LaTeX et pour cela j'y insère différents tableaux. Cependant, je rencontre un problème avec l'un d'entre eux. En effet, j'utilise la commande \multirow sur plusieurs lignes ( pas toutes ). Malheureusement, quand je compile, certains textes trop longs dépassent de la cellule.

    Voici le code entré :

    Code : Sélectionner tout - Visualiser dans une fenêtre à part
    1
    2
    3
    4
    5
    6
    7
    8
    9
    10
    11
    12
    13
    14
    15
    16
    17
    18
    19
    20
    21
    22
    23
    24
    25
    26
    27
    28
    29
    30
    31
    32
    33
    34
    35
    36
    37
    38
    39
    40
    \begin{table}[!h]
    \begin{tabular}{|m{8cm}|m{8cm}|}
    \hline
    \begin{center}
    \textbf{Objectives}
    \end{center}
     & 
     \begin{center}
     \textbf{Tasks to reach the objectives}
     \end{center}
    	\\
    \hline
    \multirow{3}{*}{See the evolution of particles in the space} & - Draw a graphic with coordinates from each particles at each iteration. \\
        & - Draw a graphic with the fitness from each particles at each iteration. \\
        & - Draw the particles on the curve of the studied function. \\
     
    ...
     
    \hline
    The program has to run on Linux & - Check regularly if the program run on Linux. \\
     
    \hline
    \multirow{3}{*}{See several parameters and evolutions of the experience} & - Add the possibility to choose which graphics the user wants to draw. \\
        & - Add the other graphics (Out of bounds graphic, diversity graphic, etc). \\
        & - Do a scale of colors on curves. Choose one color to show the gbest on the graphic. \\
     
    ...
     
    \hline
    Permit to the user to run again his experience when he wants & - Add the possibility to load a file with results and show the graphics. \\
     
    \hline
    \multirow{2}{*}{Permit to the user to intervene during the experience} & - Add the possibility to choose between a continue drawing or a step by step drawing. \\
        & - Show the current iteration and add the possibility to change manually through writing an iteration or clicking on button. \\
     
    \hline
    \end{tabular}
    \caption{Table of tasks}
    \label{Table of tasks}
    \end{table}
    Toutes les lignes n'utilisent donc pas \multirow. J'ai essayé de modifier l'astérisque dans la fonction \multirow en y mettant une largeur définie mais j'ai alors un message d'erreur.

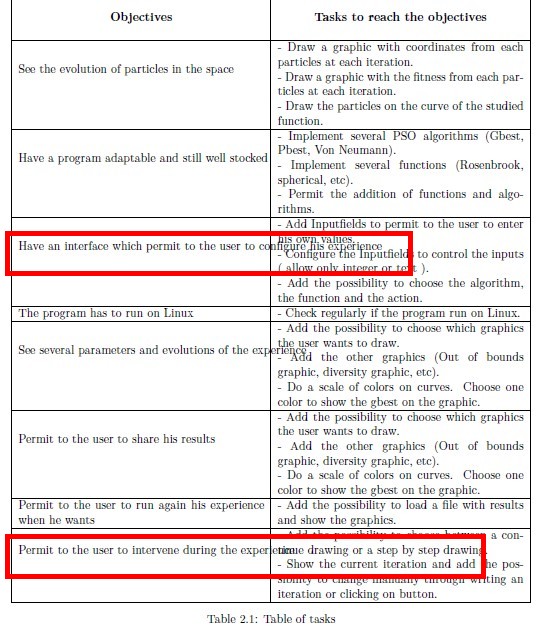
    Voici le rendu que j'ai actuellement :

    Nom : Sans titre 2.jpg
Affichages : 1300
Taille : 115,5 Ko


    Le problème se concentre uniquement sur la colonne de gauche et sur les lignes qui utilisent \multirow.

    J'ai cherché des solutions sur internet mais je n'arrive pas à régler mon problème. Je me résigne donc à demander de l'aide. Si vous avez une solution ou un lien vers lequel je peux m'orienter pour résoudre le souci, ce serait parfait.

    Je tiens à m'excuser pour le doublon si le sujet a déjà été abordé quelque part mais pour le moment, je n'ai rien trouvé qui puisse m'aider.

  2. #2
    Rédacteur/Modérateur
    Avatar de Winnt
    Homme Profil pro
    budget et contrôle de gestion
    Inscrit en
    Décembre 2006
    Messages
    1 978
    Détails du profil
    Informations personnelles :
    Sexe : Homme
    Âge : 56
    Localisation : France

    Informations professionnelles :
    Activité : budget et contrôle de gestion
    Secteur : Administration - Collectivité locale

    Informations forums :
    Inscription : Décembre 2006
    Messages : 1 978
    Points : 4 130
    Points
    4 130
    Par défaut
    Bonjour,

    Le code ci-après fonctionne parfaitement sans recours à l'extension multirow.

    Code : Sélectionner tout - Visualiser dans une fenêtre à part
    1
    2
    3
    4
    5
    6
    7
    8
    9
    10
    11
    12
    13
    14
    15
    16
    17
    18
    19
    20
    21
    22
    23
    24
    25
    26
    27
    28
    29
    30
    31
    32
    33
    34
    35
    36
    37
    38
    39
    40
    41
    42
    43
    44
    45
    46
    47
    48
    49
    50
    51
    52
    53
    54
    55
    56
    \begin{table}[!h]
    \begin{tabular}{|*{2}{m{8cm}|}}
    \hline
    \centering\textbf{Objectives} & \vspace{12pt}\centering\textbf{Tasks to reach the objectives} \tabularnewline [0.5cm]
     
    \hline
    See the evolution of particles in the space & 
    \vspace{12pt}
    \begin{itemize}
    \item Draw a graphic with coordinates from each particles at each iteration.
    \item Draw a graphic with the fitness from each particles at each iteration.
    \item Draw the particles on the curve of the studied function.
    \end{itemize} 
    \tabularnewline
     
    \hline
    The program has to run on Linux & 
    \vspace{12pt}
    \begin{itemize}
    \item Check regularly if the program run on Linux.
    \end{itemize} 
    \tabularnewline
     
    \hline
    See several parameters and evolutions of the experience & 
    \vspace{12pt}
    \begin{itemize}
    \item Add the possibility to choose which graphics the user wants to draw. 
    \item Add the other graphics (Out of bounds graphic, diversity graphic, etc).
    \item Do a scale of colors on curves. Choose one color to show the gbest on the graphic.
    \end{itemize} 
    \tabularnewline
     
    \hline
    Permit to the user to run again his experience when he wants & 
    \vspace{12pt}
    \begin{itemize}
    \item Add the possibility to load a file with results and show the graphics.
    \end{itemize} 
    \tabularnewline
     
    \hline
    Permit to the user to intervene during the experience & 
    \vspace{12pt}
    \begin{itemize}
    \item Add the possibility to choose between a continue drawing or a step by step drawing. 
    \item Show the current iteration and add the possibility to change manually through writing an iteration or clicking on button.
    \end{itemize}  
    \tabularnewline
     
    \hline
    \end{tabular}
     
    \caption{Table of tasks}
    \label{Table of tasks}
    \end{table}
    Winnt
    Merci de lire les règles du forum LaTeX et Qu'est ce qu'un ECM ?.
    N'hésitez pas à parcourir la FAQ la réponse y est peut-être déjà.
    Pensez au bouton si votre problème est résolu.


    C'est en Linuxant qu'on devient .... geek
    Et c'est en LateXant qu'on devient flemmard
    Mon blog tout neuf.
    Articles : présentation de la distribution Gentoo, Les index sous LaTeX et leur personnalisation.

  3. #3
    Candidat au Club
    Homme Profil pro
    Étudiant
    Inscrit en
    Novembre 2017
    Messages
    2
    Détails du profil
    Informations personnelles :
    Sexe : Homme
    Localisation : France, Loire Atlantique (Pays de la Loire)

    Informations professionnelles :
    Activité : Étudiant

    Informations forums :
    Inscription : Novembre 2017
    Messages : 2
    Points : 2
    Points
    2
    Par défaut
    Merci beaucoup ! ça marche parfaitement !

+ Répondre à la discussion
Cette discussion est résolue.

Discussions similaires

  1. Texte qui dépasse une div + footer décalé
    Par idate dans le forum Mise en page CSS
    Réponses: 7
    Dernier message: 16/02/2013, 06h15
  2. Transparence des PNG sous IE6 et texte qui dépasse du conteneur
    Par shubakas dans le forum Mise en page CSS
    Réponses: 6
    Dernier message: 20/05/2008, 15h35
  3. Texte qui dépasse de l'image
    Par Luffy49 dans le forum Mise en page CSS
    Réponses: 2
    Dernier message: 25/01/2008, 12h49
  4. Problème de zone de texte qui s'étire.
    Par Shugo78 dans le forum GTK+ avec C & C++
    Réponses: 6
    Dernier message: 01/08/2007, 22h04
  5. [VBA] Problème récup texte d'une cellule dans un tableau
    Par Marco le Pouillot dans le forum Macros et VBA Excel
    Réponses: 11
    Dernier message: 30/01/2006, 17h06

Partager

Partager
  • Envoyer la discussion sur Viadeo
  • Envoyer la discussion sur Twitter
  • Envoyer la discussion sur Google
  • Envoyer la discussion sur Facebook
  • Envoyer la discussion sur Digg
  • Envoyer la discussion sur Delicious
  • Envoyer la discussion sur MySpace
  • Envoyer la discussion sur Yahoo