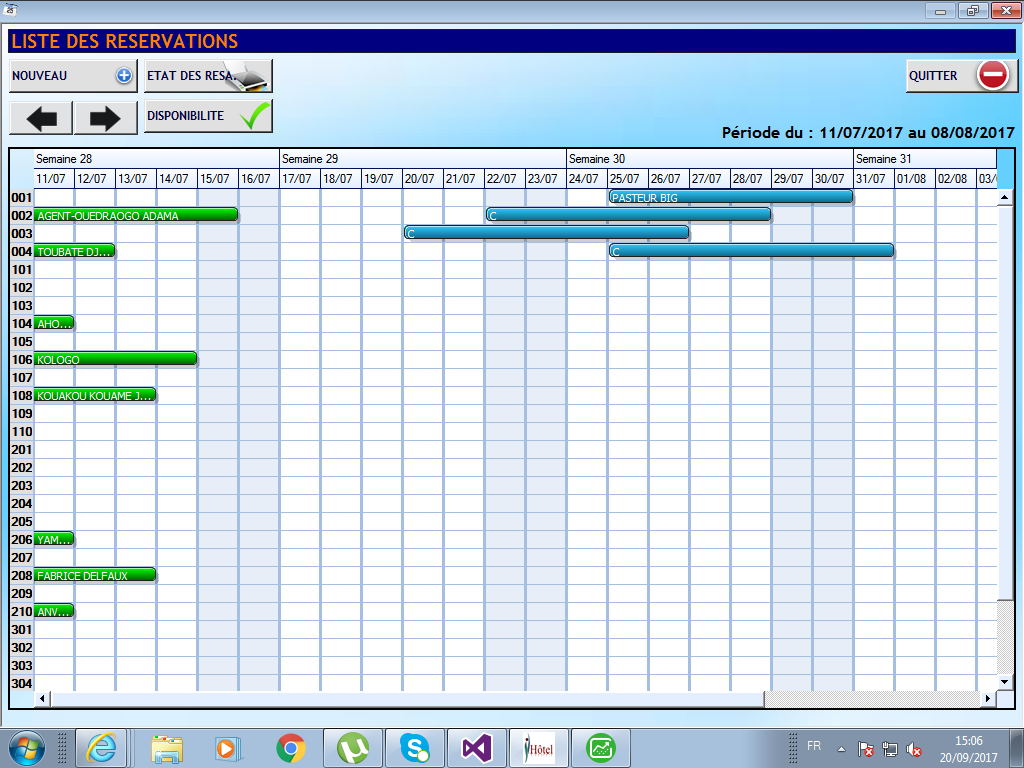
Bonjour à tous je souhaite faire un planning dans un datagridview en c# comme ceci
Bonjour,
Il faut éviter les doubles post
Sinon je te déconseille d'utiliser winform pour faire ce que veux. Tu ne pourras pas obtenir ce que tu veux avec les controls de base. Tu serais obligé de faire un control perso (au mieux surcharger la datagridview...), de dessiner toi même les 'traits' bleu et vert qui passent au dessus des celllules, ou alors à partir d'une tableLayoutPanel, mais la tu vas avoir le risque d'une interface 'sapin de noël' qui clignote des que tu modifie un truc ou que tu déplace la fenêtre ... bref beaucoup beaucoup d'effort pour un résultat loin d'être top et encore plus loin de ce que tu veux obtenir.
En faite j'ai un besoin similaire (faire un calendrier), et je suis en train de tester et de me former à WPF juste pour ça ... bon aussi parce qu'il faut bien évoluer et que la on parle d'une techno obsolète depuis 10ans et qui a été crée à une époque ou les besoin en IHM n'était pas les mêmes que ceux d'aujourd'hui...
Il y a quelques controls que tu pourras trouver sur le net, tout prêt, mais perso j'ai jamais croisé de choses intéressantes.
J@ck.
Pas de réponse par MP, merci.
Penser au ça fait plaisir
sinon en WinDev j'ai déjà fait cela sans problème c'est en c# qu'il y a problème
Ah mince pas fait gaffe je croyais que l'ont étaient dans le forum winForm.
Mais mon commentaire n'était pas inutile non plus. C'est simplement que c# c'est le langage, pour faire du graphique il va falloir que tu choisisses une bibliothèque graphique. Pour ce que je connais,
en windows client lourd, on a winForm, qui a été remplacé par WPF vers 2006-2007, lui même remplacé par UWP depuis windows 10 (on va oublier les trucs inutiles qui n'ont pas marché).
Donc si tu as le choix évite winForm.
WinDev je connais que de nom et de réputation, mais je pense qu'on touche là à un des gros intérêt de ce genre de solution... on te livre le truc clé en main avec tout ce qu'il manque en natif dans les divers techno, mais dont on a toujours besoin à un moment ou un autre.
Désolé je pourrais pas t'aider plus, contre la suite de tes recherches m'intéresse, et encore plus si tu choisis au final WPF
J@ck.
Pas de réponse par MP, merci.
Penser au ça fait plaisir
Ce sont deux languages différents avec des framework différents et des façon de faire différentes. Donc pas de comparaison possible.
Le datagridview est un composant fait pour afficher des données dans un tableau. Il ne répond donc pas à ton besoin. Pour ma part je t'orienterais soit vers un Chart (type barre) soit, si ton besoin est plus précis, à un contrôle maison. Mais il y a du boulot pour avoir un composant propre..
Bonjour,
Je rejoins ZenZiTone, et pour préciser je m'orienterais vers l'utilisation d'un diagramme de Gantt.
Il y a plein de composants déjà existant et/ou d'article a voir sur le sujet.
Bon je ne sais pas ce qu'ils valent, n'ayant jamais eu ce besoin, après à toi de te faire ton idée en fonction de tes besoins.
Bonne continuation.
L’aléatoire n’existe pas en informatique, c’est juste un moyen de dire que l’on a pas encore compris.
Tu part donc sur du web avec Asp.net ? Attention a ne pas tout mélanger ...
throw new NoSignatureException();
même avec un datagridview c'est possible.
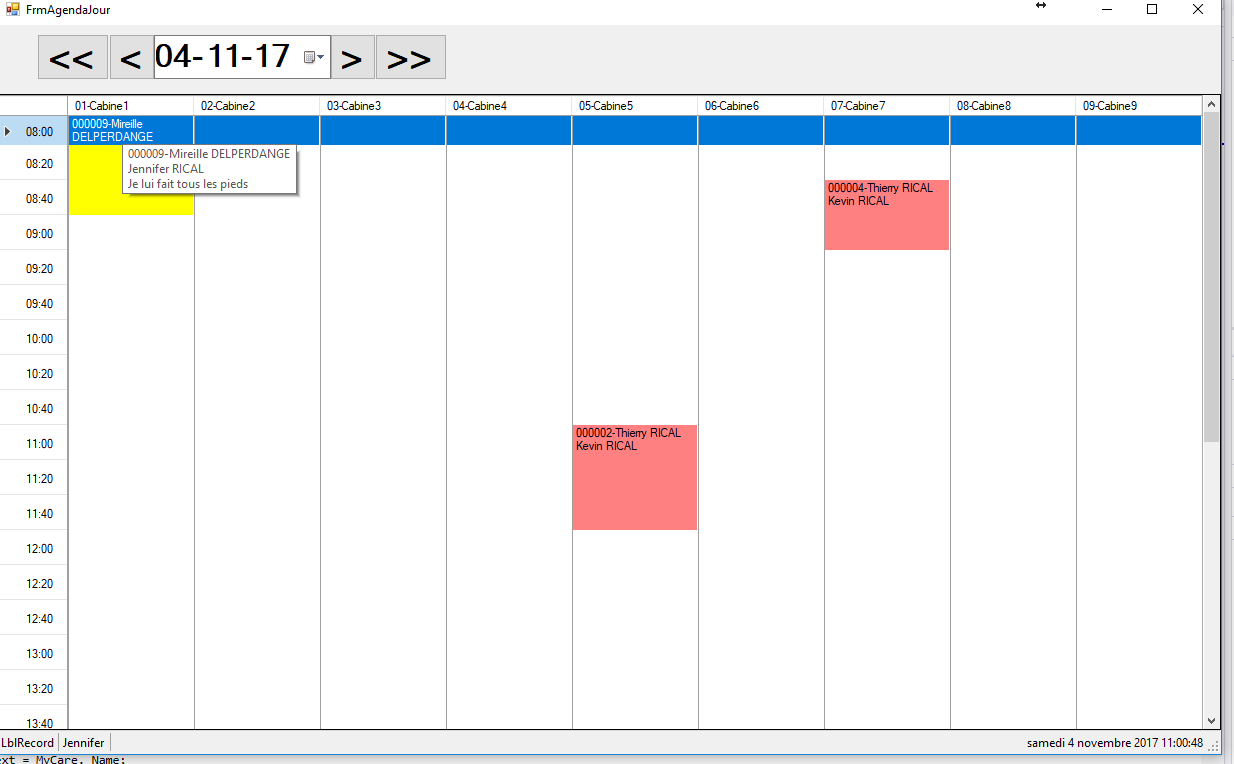
exemple d'un agenda , que je suis occupé a faire ( construire ) en fonction des besoins.
La Connaissance est comme la joie elle s'accroît en la partageant!
bonjour
Il n'est pas possible de peindre un rectangle ou toute autre shape chevauchant plusieurs cellules et cela est du au fonctionnement interne du DGV....
La peinture du DGV est basée sur la peinture de chaque cellule car chacune contient un Control d’édition...
Et le dessin des cellules est rafraîchi dans de nombreux évents ,ce qui efface toute peinture en chevauchement de cellules contenue dans un row ...
Il existe néanmoins 2 possibilités :
2/ Event CellPainting (1er exemple)...
-le plus simple puisque on peint le background de chaque cellule
- un "simili rectangle" dont les cotes sont faits de morceaux appartenant aux cellules adjacentes pas très joli...
2/ cellule DataGridViewImageCell et son DataGridViewImageColumn associé (2er exemple)...
-peindre le "rectangle diagramme" ligne par ligne dans un bitmap .
Cette solution "pixel proportionnel" utilise 2 évents :
-CellPainting pour dessiner le Header et
-CellFormatting pour dessiner le "diagramme" sur le Bitmap du DataGridViewImageColumn.
code behind .cs du class data d'exemple MyTask commun aux 2 exemples :
code behind .cs du Form Demo (1er exemple) :
Code : Sélectionner tout - Visualiser dans une fenêtre à part
1
2
3
4
5
6
7
8
9
10
11
12
13
14
15
16
17
18
19
20
21
22
23
24
25
26
27
28
29
30
31
32
33
34
35
36
37
38
39
40
41
42
43
44
45 namespace WinPaintCalendarDGV { public class MyTask { public string Name { get; set; } public DateTime FromDate { get; set; } public DateTime ToDate { get; set; } public int FromDay { get { return FromDate.Day; } } public int ToDay { get { return ToDate.Day; } } } public class MyTasks : List<MyTask> { private DateTime theDate; private DateTime maxDate; private Random rnd = new Random(); public MyTasks() { } public MyTasks(DateTime pdate) : this() { theDate = pdate; maxDate = theDate.AddDays(30); for (int i = 1; i < 11; i++) { int num1 = rnd.Next(5, 15); DateTime date1 = theDate.AddDays(num1); int num2 = rnd.Next(5, 15); DateTime date2 = date1.AddDays(num2); if (date2 > maxDate) date2 = maxDate; MyTask p = new MyTask() { Name = "Person" + i.ToString(), FromDate = date1, ToDate = date2 }; this.Add(p); } } } }
Code : Sélectionner tout - Visualiser dans une fenêtre à part
1
2
3
4
5
6
7
8
9
10
11
12
13
14
15
16
17
18
19
20
21
22
23
24
25
26
27
28
29
30
31
32
33
34
35
36
37
38
39
40
41
42
43
44
45
46
47
48
49
50
51
52
53
54
55
56
57
58
59
60
61
62
63
64
65
66
67
68
69
70
71
72
73
74
75
76
77
78
79
80
81
82
83
84
85
86
87
88
89
90
91
92
93
94
95
96
97
98
99
100
101
102
103
104
105
106
107
108
109
110
111
112
113
114
115
116
117
118
119
120 namespace WinPaintCalendarDGV { public partial class TestPaintCells : Form { private int offsetIndex = 0; private DateTime date; private MyTasks tasks = null; public TestPaintCells() { InitializeComponent(); } private void TestPaintCells_Load(object sender, EventArgs e) { date = new DateTime(DateTime.Now.Year, 1, 1); tasks = new MyTasks(date); this.dgv.DataSource = tasks; //fige les 3 premieres colonnes for (int i = 0; i < 3; i++) { this.dgv.Columns[i].Frozen = true; } // ajout par code des colonnes de jours int numSemaine = 1; offsetIndex = this.dgv.Columns.Count-1; for (int i = offsetIndex+1; i < offsetIndex+1+ 32; i++) { DataGridViewTextBoxColumn txtCol = new DataGridViewTextBoxColumn(); txtCol.Name = "Jour" + i.ToString(); if (i % 7 == 0) { numSemaine += 1; txtCol.HeaderText = "Semaine " + numSemaine.ToString() + Environment.NewLine; } else if (i == offsetIndex) { txtCol.HeaderText = "Semaine " + numSemaine.ToString() + Environment.NewLine; } txtCol.HeaderText += date.ToShortDateString(); date = date.AddDays(1); this.dgv.Columns.Insert(i, txtCol); } } private void dgv_CellPainting(object sender, DataGridViewCellPaintingEventArgs e) { if (e.RowIndex < 0) return; DataGridViewRow row = this.dgv.Rows[e.RowIndex]; int fromCol = (int)row.Cells["FromDay"].Value; int toCol = (int)row.Cells["ToDay"].Value; fromCol += offsetIndex ; toCol += offsetIndex; if (e.ColumnIndex >= fromCol && e.ColumnIndex <= toCol) { using (Brush gridBrush = new SolidBrush(Color.Blue), backColorBrush = new SolidBrush(e.CellStyle.BackColor)) { using (Pen gridLinePen = new Pen(gridBrush,2.0f)) { gridLinePen.Alignment = PenAlignment.Inset; gridLinePen.LineJoin = LineJoin.Round; // Efface le background par defaut. e.Graphics.FillRectangle(backColorBrush, e.CellBounds); Point pt1 = new Point(e.CellBounds.Left+1, e.CellBounds.Top+1); Point pt2 = new Point(e.CellBounds.Right-1 , e.CellBounds.Top+1); Point pt3 = new Point(e.CellBounds.Right-1 , e.CellBounds.Bottom-1 ); Point pt4 = new Point(e.CellBounds.Left+1, e.CellBounds.Bottom-1 ); // Draw the background cell e.Graphics.FillRectangle(Brushes.Crimson, e.CellBounds); // Draw the grid lines ; //cote gauche if (e.ColumnIndex == fromCol) { e.Graphics.DrawLine(gridLinePen, pt1, pt4); // le texte object recipe = row.Cells["Name"].Value; if (recipe != null) { string txt = recipe as string; e.Graphics.DrawString(txt, e.CellStyle.Font, Brushes.Yellow , e.CellBounds.X + 2, e.CellBounds.Y + 2, StringFormat.GenericDefault); } } //cote droit if (e.ColumnIndex == this.dgv.Columns[toCol].Index) { e.Graphics.DrawLine(gridLinePen, pt2, pt3); } //cote haut e.Graphics.DrawLine(gridLinePen, pt1, pt2); //cote bas bottom e.Graphics.DrawLine(gridLinePen, pt4, pt3); e.Handled = true; } } } } } }
code behind .cs du Form Demo (2er exemple):
Mais le mieux c'est les Winforms Wpf...
Code : Sélectionner tout - Visualiser dans une fenêtre à part
1
2
3
4
5
6
7
8
9
10
11
12
13
14
15
16
17
18
19
20
21
22
23
24
25
26
27
28
29
30
31
32
33
34
35
36
37
38
39
40
41
42
43
44
45
46
47
48
49
50
51
52
53
54
55
56
57
58
59
60
61
62
63
64
65
66
67
68
69
70
71
72
73
74
75
76
77
78
79
80
81
82
83
84
85
86
87
88
89
90
91
92
93
94
95
96
97
98
99
100
101
102
103
104
105
106
107
108
109
110
111
112
113
114
115
116
117
118
119
120
121
122
123
124
125
126
127
128
129
130
131
132
133
134
135
136
137
138
139
140
141
142
143
144
145
146
147
148
149
150
151
152
153
154
155
156
157
158
159
160
161
162
163
164
165
166
167
168 namespace WinPaintCalendarDGV { public partial class TestCellImage : Form { Bitmap bmp = null; private int maxDayMonth = 31; private DateTime date; private MyTasks tasks = null; public TestCellImage() { InitializeComponent(); } private void TestTask_Load(object sender, EventArgs e) { this.dgv.ColumnHeadersHeight = 100; //taille suffisante pour l'echelle dessinée date = new DateTime(DateTime.Now.Year, 1, 1); tasks = new MyTasks(date); this.dgv.DataSource = tasks; //le CellImage DataGridViewImageCell cell = new DataGridViewImageCell(); cell.Style.BackColor = Color.White; cell.Style.ForeColor = Color.Red; cell.ReadOnly = false; //et son ImageColumn associé DataGridViewImageColumn col = new DataGridViewImageColumn(); col.Name = "GANT"; col.Width = 600; bmp = new Bitmap(col.Width, col.Width); col.HeaderText = "Gant Diagramme"; col.CellTemplate = cell; col.ImageLayout = DataGridViewImageCellLayout.Normal; this.dgv.Columns.Add(col); } private void dgv_CellFormatting(object sender, DataGridViewCellFormattingEventArgs e) { if (e.RowIndex < 0 && e.ColumnIndex < 0) return; if (this.dgv.Columns[e.ColumnIndex].Name.Equals("GANT")) { DataGridViewRow row = this.dgv.Rows[e.RowIndex]; DataGridViewColumn col= this.dgv.Columns[e.ColumnIndex]; DataGridViewImageCell cell = (DataGridViewImageCell)row.Cells[e.ColumnIndex]; //on cree un nouveau bitmap pour chaque row bmp = new Bitmap(col.Width, col.Width); int totaldays = maxDayMonth; float ratio = bmp.Width / totaldays; int fromCol = (int)row.Cells["FromDay"].Value; int toCol = (int)row.Cells["ToDay"].Value; float x0, x1; PointF p0, p1; using (Graphics gr = Graphics.FromImage(bmp)) { gr.SmoothingMode = SmoothingMode.HighQuality; gr.TextRenderingHint = TextRenderingHint.ClearTypeGridFit; gr.InterpolationMode = InterpolationMode.High; // Fill Barre x0 = (fromCol-1) * ratio; x1 = toCol * ratio; p0 = new PointF(x0, bmp.Height / 2); p1 = new PointF(x1, bmp.Height / 2); float width = (p1.X - p0.X); float height = row.Height / 2; RectangleF[] rects = new RectangleF[1]; p0.Y -= height / 2; rects[0] = new RectangleF(p0, new SizeF(width, height)); using (SolidBrush br = new SolidBrush(Color.Red)) { gr.FillRectangle(br, Rectangle.Ceiling(rects[0])); } // Rectangle Barre using (Pen pen = new Pen(Brushes.Blue, 2.0f)) { gr.DrawRectangle(pen, Rectangle.Ceiling(rects[0])); } // Le Text p0.X += 25; string text = this.dgv.Rows[e.RowIndex].Cells["Name"].Value.ToString(); using (Brush br = new SolidBrush(Color.Yellow)) { gr.DrawString(text, e.CellStyle.Font, br, p0); } } e.Value = bmp; } } //e.PaintContent(e.ClipBounds); //peinture du Header des Colonnes private void dgv_CellPainting(object sender, DataGridViewCellPaintingEventArgs e) { if (e.RowIndex == -1 && e.ColumnIndex >= 0) { Graphics gr = e.Graphics; gr.SmoothingMode = SmoothingMode.HighQuality; gr.TextRenderingHint = TextRenderingHint.ClearTypeGridFit; string text = this.dgv.Columns[e.ColumnIndex].HeaderText ; gr.FillRectangle(Brushes.Yellow, e.CellBounds); gr.DrawString(text, dgv.DefaultCellStyle.Font, Brushes.Red, e.CellBounds); // Graduations Echelle Horizontale et Jours if (this.dgv.Columns[e.ColumnIndex].Name == "GANT") { int totaldays = maxDayMonth; float ratio = e.CellBounds.Width / totaldays; float x0 = e.CellBounds.X; float y0 = e.CellBounds.Height / 3; using (Pen penScale = new Pen(Brushes.Black, 2.0f)) { penScale.EndCap = LineCap.Square; penScale.Alignment = PenAlignment.Center; int numWeek = 1; for (int i = 1; i <maxDayMonth ; i++) { PointF p0 = new PointF(x0, y0 ); PointF p1 = new PointF(x0, y0 + 40); StringFormat fmt = new StringFormat(); fmt.LineAlignment = StringAlignment.Center; if (i == 1) { gr.DrawString("Semaine" + numWeek.ToString(), dgv.DefaultCellStyle.Font, Brushes.Red, p0.X - 4.0f, p0.Y, fmt); numWeek += 1; } else if (i % 7 == 0) { gr.DrawString("Semaine" + numWeek.ToString(), dgv.DefaultCellStyle.Font, Brushes.Red, p0.X - 4.0f, p0.Y, fmt); numWeek += 1; } gr.DrawString(i.ToString(), dgv.DefaultCellStyle.Font, Brushes.Black, p0.X - 4.0f, p0.Y); p0.Y += 30; gr.DrawLine(penScale, p0, p1); x0 += ratio; } } } // paintsparts exclut le background et le content du header // car il est dessine (operateur de bit NOT => ~ ) DataGridViewPaintParts args = (DataGridViewPaintParts.All & ~DataGridViewPaintParts.Background & ~DataGridViewPaintParts.ContentForeground); e.Paint(e.ClipBounds, args); e.Handled = true; } } } }
Code behind.cs du class data MyTask versus Wpf:
code xaml simplistic du Form user et le résultât tant souhaité:
Code : Sélectionner tout - Visualiser dans une fenêtre à part
1
2
3
4
5
6
7
8
9
10
11
12
13
14
15
16
17
18
19
20
21
22
23
24
25
26
27
28
29
30
31
32
33
34
35
36
37
38
39
40
41
42
43
44
45
46
47
48
49
50
51
52
53
54
55
56
57
58
59
60
61
62
63
64
65
66
67
68
69
70
71
72
73
74
75
76
77
78
79
80
81
82
83
84
85
86
87
88
89
90
91
92
93
94
95
96
97
98
99
100
101
102
103
104
105
106
107
108
109
110
111
112
113
114
115
116
117
118
119
120
121
122
123
124
125
126
127
128
129
130
131
132
133
134
135
136 using System; using System.Windows; using System.ComponentModel; using System.Collections.ObjectModel; namespace WpfPaintCalendarDGV { public class MyTask:INotifyPropertyChanged { public MyTask() { } private string name; public string Name { get { return name; } set { name = value; NotifyPropertyChanged("Name"); } } private DateTime fromDate ; public DateTime FromDate { get { return fromDate ; } set { fromDate = value; NotifyPropertyChanged("FromDate"); } } private DateTime toDate; public DateTime ToDate { get { return toDate; } set { toDate = value; NotifyPropertyChanged("ToDate"); } } private int duration; public int Duration { get { return duration; } set { duration = value; NotifyPropertyChanged("Duration"); } } private Rect rect = new Rect(); public Rect Rect { get { return rect; } set { rect = value; NotifyPropertyChanged("Rect"); } } private double height = 25; public double Height { get { return height; } set { height = value; Rect = new Rect(this.FromDate.Day, Top, Duration * 100, height); NotifyPropertyChanged("Height"); } } private double top = 10; public double Top { get { return top; } set { top = value; Rect = new Rect(this.FromDate.Day, top, Duration * 100, Height); NotifyPropertyChanged("Top"); } } public event PropertyChangedEventHandler PropertyChanged; private void NotifyPropertyChanged(string n) { PropertyChangedEventHandler h = PropertyChanged; if (h != null) h(this, new PropertyChangedEventArgs(n)); } } public class MyTasks : ObservableCollection <MyTask> { private DateTime theDate ; private DateTime maxDate; private Random rnd = new Random(); public MyTasks() { theDate = new DateTime(2017,1,1); maxDate = theDate.AddDays(30); for (int i = 1; i < 11; i++) { int num1 = rnd.Next(5, 15); DateTime date1 = theDate.AddDays(num1); int num2 = rnd.Next(5, 15); DateTime date2 = date1.AddDays(num2); if (date2 > maxDate) date2 = maxDate; MyTask p = new MyTask() { Name = "Person" + i.ToString(), FromDate = date1, ToDate = date2 }; p.Duration =1 + (p.ToDate - p.FromDate).Days; p.Rect =new Rect(p.FromDate.Day,p.Top, p.Duration * 100, p.Height ); this.Add(p); } } public MyTasks(DateTime pdate) : this() { theDate = pdate; maxDate = theDate.AddDays(30); for (int i = 1; i < 11; i++) { int num1 = rnd.Next(5, 15); DateTime date1 = theDate.AddDays(num1); int num2 = rnd.Next(5, 15); DateTime date2 = date1.AddDays(num2); if (date2 > maxDate) date2 = maxDate; MyTask p = new MyTask() { Name = "Person" + i.ToString(), FromDate = date1, ToDate = date2 }; p.Duration =1 + (p.ToDate - p.FromDate).Days; this.Add(p); } } } }
code behind.cs autogeneré par le desinger de VS Studio:
Code : Sélectionner tout - Visualiser dans une fenêtre à part
1
2
3
4
5
6
7
8
9
10
11
12
13
14
15
16
17
18
19
20
21
22
23
24
25
26
27
28
29
30
31
32
33
34
35
36
37
38
39
40
41
42
43
44
45
46
47
48
49
50
51
52
53
54
55
56
57 <Window x:Class="WpfPaintCalendarDGV.MainWindow" xmlns="http://schemas.microsoft.com/winfx/2006/xaml/presentation" xmlns:x="http://schemas.microsoft.com/winfx/2006/xaml" xmlns:local="clr-namespace:WpfPaintCalendarDGV" Title="MainWindow" Height="350" Width="525"> <Window.Resources> <local:MyTasks x:Key="data"/> <DataTemplate x:Key="template" DataType="{x:Type local:MyTask}"> <Grid> <Path HorizontalAlignment="Center" VerticalAlignment="Center" Margin="5" Stroke="Blue" > <Path.Fill> <LinearGradientBrush StartPoint="0,0" EndPoint="1.0,1.0" > <LinearGradientBrush.GradientStops> <GradientStop Color="LimeGreen" Offset="0.25"/> <GradientStop Color="Yellow" Offset="0.50"/> </LinearGradientBrush.GradientStops> </LinearGradientBrush> </Path.Fill> <Path.Data> <RectangleGeometry RadiusX="8" RadiusY="8" Rect="{Binding Rect,Mode=TwoWay}"> </RectangleGeometry> </Path.Data> </Path> <TextBlock HorizontalAlignment="Center" VerticalAlignment="Center" Foreground="Red" FontSize="14" Text="{Binding Name}"/> </Grid> </DataTemplate> </Window.Resources> <Grid> <DataGrid AutoGenerateColumns="False" ItemsSource="{Binding Source={StaticResource data}}" > <DataGrid.Columns> <DataGridTextColumn Header="Name" Binding="{Binding Name}"/> <DataGridTextColumn Header="FromDate" Binding="{Binding FromDate,StringFormat=d}"/> <DataGridTextColumn Header="ToDate" Binding="{Binding ToDate,StringFormat=d}"/> <DataGridTextColumn Header="Duration" Binding="{Binding Duration}"/> <DataGridTextColumn Header="TopDiagram" Binding="{Binding Top,Mode=TwoWay}"/> <DataGridTextColumn Header="HeightDiagram" Binding="{Binding Height,Mode=TwoWay}"/> <DataGridTemplateColumn CellTemplate="{StaticResource template}"/> </DataGrid.Columns> </DataGrid > </Grid> </Window>
bon code...
Code : Sélectionner tout - Visualiser dans une fenêtre à part
1
2
3
4
5
6
7
8
9
10
11
12
13
14
15
16
17
18
19
20
21
22
23
24
25
26
27
28 using System; using System.Collections.Generic; using System.Linq; using System.Text; using System.Windows; using System.Windows.Controls; using System.Windows.Data; using System.Windows.Documents; using System.Windows.Input; using System.Windows.Media; using System.Windows.Media.Imaging; using System.Windows.Navigation; using System.Windows.Shapes; namespace WpfPaintCalendarDGV { /// <summary> /// Logique d'interaction pour MainWindow.xaml /// </summary> public partial class MainWindow : Window { public MainWindow() { InitializeComponent(); } } }
Voila ce qui s'appel être complet
je vais m'inspirer de se savoir pour évolué dans mon planning. Qui fonctionne bien pour l'instant, vis à vis du besoin actuel.
J'arrive même a détecter les chevauchements de RDV en cas d'ajout ou de modification .
Mais sûre que j'ai encore a faire.
Merci bien des conseils
La Connaissance est comme la joie elle s'accroît en la partageant!
Vous avez un bloqueur de publicités installé.
Le Club Developpez.com n'affiche que des publicités IT, discrètes et non intrusives.
Afin que nous puissions continuer à vous fournir gratuitement du contenu de qualité, merci de nous soutenir en désactivant votre bloqueur de publicités sur Developpez.com.
Partager