1
2
3
4
5
6
7
8
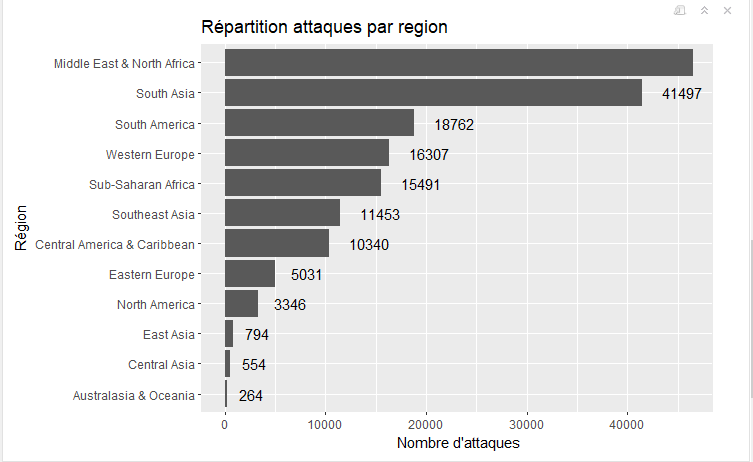
| ## Répartition attaques par régions
regionAttacks <- data.frame(table(df['region_txt']))
names(regionAttacks)[1] <- "region"
names(regionAttacks)[2] <- "nbAttacks"
orderRegion <- regionAttacks[order(regionAttacks$nbAttacks),]
s <- ggplot(orderRegion, aes(y = nbAttacks, x = reorder(region, nbAttacks))) + xlab("Région") + ylab("Nombre d'attaques") + ggtitle("Répartition attaques par region") + geom_bar(stat = "identity") + coord_flip() + theme(plot.margin = unit(c(0, -0.1, 0, 0), "cm")) + geom_text(aes(label=nbAttacks), hjust=-0.5, color='black')
print(s) |


 Répondre avec citation


Partager