1
2
3
4
5
6
7
8
9
10
11
12
13
14
15
16
17
18
19
20
21
22
23
24
25
26
27
28
29
30
31
32
33
34
35
36
37
38
39
40
41
42
43
44
45
46
47
48
49
50
51
52
53
54
55
56
57
58
59
60
61
62
63
64
65
66
67
68
69
70
71
72
73
74
75
76
77
78
79
80
81
82
83
84
85
86
87
88
89
90
91
92
93
94
95
96
97
98
99
100
101
102
103
104
105
106
107
108
109
110
111
112
113
114
115
116
117
118
| <!DOCTYPE html>
<html>
<head>
<meta charset="utf-8">
<meta http-equiv="X-UA-Compatible" content="IE=edge">
<title>TEST HIGHCHARTS</title>
</head>
<script src="https://code.jquery.com/jquery-3.1.0.min.js" type="text/javascript"></script>
<script src="https://code.highcharts.com/stock/highstock.js" type="text/javascript"></script>
<script src="https://code.highcharts.com/stock/modules/exporting.js" type="text/javascript"></script>
<script type="text/javascript">
$(document).ready(function () {
AffichageGraph();
});
function AffichageGraph() {
$.ajax({
type: "GET",
url: 'XML/PackDO_Datas_Graphs.xml',
dataType: 'xml',
success: readXML,
data: {
_rnd: new Date().getTime()
}
});
}
function readXML(xml) {
var options = {
rangeSelector: {
buttonTheme: { width: 70 },
buttons: [{ type: 'day', count: 1, text: '1 jour' },
{ type: 'day', count: 7, text: '7 jours' },
{ type: 'month', count: 1, text: '1 mois' },
{ type: 'all', count: 1, text: 'Tous'}],
inputEnabled: true,
selected: 3
},
lang: {
months: ['Janvier', 'Février', 'Mars', 'Avril', 'Mai', 'Juin', 'Juillet', 'Août', 'Septembre', 'Octobre', 'Novembre', 'Décembre'],
weekdays: ['Dimanche', 'Lundi', 'Mardi', 'Mercredi', 'Jeudi', 'Vendredi', 'Samedi'],
shortMonths: ['Jan', 'Fev', 'Mar', 'Avr', 'Mai', 'Juin', 'Juil', 'Août', 'Sept', 'Oct', 'Nov', 'Déc'],
decimalPoint: ',',
resetZoom: 'Reset zoom',
resetZoomTitle: 'Reset zoom à 1:1',
downloadPNG: 'Télécharger au format PNG',
downloadJPEG: 'Télécharger au format JPEG',
downloadPDF: 'Télécharger au format PDF',
downloadSVG: 'Télécharger au format SVG',
exportButtonTitle: 'Exporter image ou document',
printButtonTitle: 'Imprimer le graphique',
loading: 'Chargement...'
},
//Informations concernant le graphe en générales
chart: { renderTo: 'container' },
//Informations concernant le graphe en générales
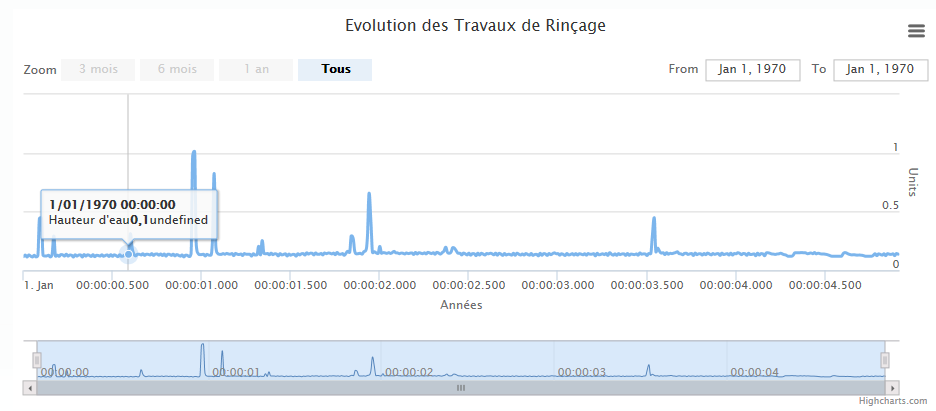
title: { text: 'Mesures des hauteurs d\'eau des DO' },
//Informations concernant l'axe X
xAxis: {
type: 'datetime',
categories: []
},
//Informations concernant l'axe Y
yAxis: {
min: 0,
title: { text: 'Hauteur d\'eau' },
labels: { overflow: 'justify' }
},
//Informations concernant les séries de données
series: [{
name: 'Sonde S1',
data: []
}],
dateFormat: { format: '%d/%m/%Y %H:%MM:%S' },
//Informations concernant les tooltips
tooltip: {
formatter: function () {
var s = '<b>' + Highcharts.dateFormat('%d/%m/%Y %H:%M:%S', this.x) + '</b>';
$.each(this.points, function (i, point) {
var unit = {
'Sonde S1': ' mètres'
}[this.point.series.name];
s = s + '<br/>';
s = s + '<span style="color:' + point.series.color + '">' + point.series.name + ': </span>';
s = s + ' <b>';
s = s + Highcharts.numberFormat(point.y, 1, ",", " ");
s = s + '</b> ';
s = s + unit;
});
return s;
}
}
};
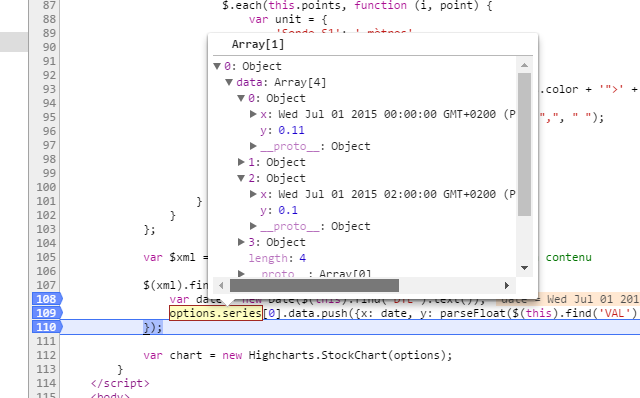
var $xml = $(xml); //On définie la variable xml par son contenu
$(xml).find('dsGraphes > GET_DATAS').each(function () {
options.xAxis.categories.push($(this).find('DTE').text());
options.series[0].data.push(parseFloat($(this).find('VAL').text()));
});
var chart = new Highcharts.StockChart(options);
}
</script>
<body>
<div id="container" style="width:800px; height:400px; margin:auto;"></div>
</body>
</html> |


 Répondre avec citation


Partager