1
2
3
4
5
6
7
8
9
10
11
12
13
14
15
16
17
18
19
20
21
22
23
24
25
26
27
28
29
30
31
32
33
34
35
36
37
38
39
40
41
42
43
44
45
46
47
48
49
50
51
52
53
54
55
56
57
58
59
60
61
62
63
64
65
66
67
68
69
70
71
72
73
74
75
76
77
78
79
80
81
82
83
84
85
86
87
88
89
90
91
92
93
94
95
96
97
98
99
100
101
102
103
104
105
106
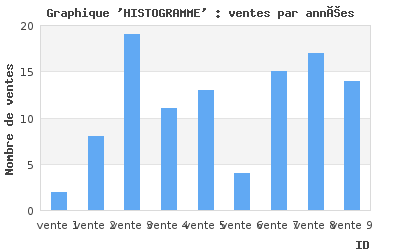
| <?php
include ("jpgraph/src/jpgraph.php");
include ("jpgraph/src/jpgraph_bar.php");
define('MYSQL_HOST', 'localhost');
define('MYSQL_USER', 'root');
define('MYSQL_PASS', '');
define('MYSQL_DATABASE', 'ventes');
$tableauVente = array();
$tableauPrix = array();
$mois="";
$annee="";
// **********************************************
// Extraction des données dans la base de données
// *************************************************
// formulaire
if(isset($_POST['mois'])) && (isset($_POST['annee']))
{
$mois=$_REQUEST['mois'];
$annee=$_REQUEST['annee'];
}
$sql =
'SELECT
ID AS vente,
sum(PRIX) AS PRIX
FROM `ventes`
where YEAR(`DTHR_VENTE`)='.$annee.' AND MONTH(DTHR_VENTE) ='.$mois.'
GROUP BY ID'
;
$mysqlCnx = @mysql_connect(MYSQL_HOST, MYSQL_USER, MYSQL_PASS) or die('Pb de connxion mysql');
@mysql_select_db(MYSQL_DATABASE) or die('Pb de sélection de la base');
$mysqlQuery = @mysql_query($sql, $mysqlCnx) or die('Pb de requête');
while ($row = mysql_fetch_array($mysqlQuery, MYSQL_ASSOC)) {
$tableauVente[] = 'vente ' . $row['vente'];
$tableauPrix[] = $row['PRIX'];
}
/*
printf('<pre>%s</pre>', print_r($tableauAnnees,1));
printf('<pre>%s</pre>', print_r($tableauNombreVentes,1));
*/
// *******************
// Création du graphique
// *******************
// Construction du conteneur
// Spécification largeur et hauteur
$graph = new Graph(400,250);
// Réprésentation linéaire
$graph->SetScale("textlin");
// Ajouter une ombre au conteneur
$graph->SetShadow();
// Fixer les marges
$graph->img->SetMargin(40,30,25,40);
// Création du graphique histogramme
$bplot = new BarPlot($tableauPrix);
// Spécification des couleurs des barres
$bplot->SetFillColor(array('red', 'green', 'blue'));
// Une ombre pour chaque barre
$bplot->SetShadow();
// Afficher les valeurs pour chaque barre
$bplot->value->Show();
// Fixer l'aspect de la police
$bplot->value->SetFont(FF_ARIAL,FS_NORMAL,9);
// Modifier le rendu de chaque valeur
$bplot->value->SetFormat('%d ventes');
// Ajouter les barres au conteneur
$graph->Add($bplot);
// Le titre
$graph->title->Set("Graphique 'HISTOGRAMME' : ventes par années");
$graph->title->SetFont(FF_FONT1,FS_BOLD);
// Titre pour l'axe horizontal(axe x) et vertical (axe y)
$graph->xaxis->title->Set("ID");
$graph->yaxis->title->Set("Nombre de ventes");
$graph->yaxis->title->SetFont(FF_FONT1,FS_BOLD);
$graph->xaxis->title->SetFont(FF_FONT1,FS_BOLD);
// Légende pour l'axe horizontal
$graph->xaxis->SetTickLabels($tableauVente);
// Afficher le graphique
$graph->Stroke();
?> |


 Répondre avec citation


Partager