1
2
3
4
5
6
7
8
9
10
11
12
13
14
15
16
17
18
19
20
21
22
23
24
25
26
27
28
29
30
31
32
33
34
35
36
37
38
39
40
41
42
43
44
45
46
47
48
49
50
51
52
53
54
55
56
57
58
59
60
61
62
63
64
65
66
67
68
69
70
71
72
73
74
75
76
77
78
79
80
81
82
83
84
85
86
87
88
89
90
91
92
93
94
95
96
97
98
99
100
101
102
103
104
105
106
|
<?php
include ("requetes.php");
include ("jpgraph/src/jpgraph.php");
include ("jpgraph/src/jpgraph_bar.php");
$tab_ligne = array();
$tab_Station1 = array(4,2,0);
$tab_Station2 = array(1,0,0);
$tab_Station3 = array(0,0,1);
$presenceLigne = 0;
while ($data = $REQ_Total_Arrets_Station->fetch())
{
foreach ($tab_ligne as $key)
{
if ($key == $data['NomLigne'] )
{
$presenceLigne = 1;
}
}
if ($presenceLigne == 0 )
{
$tab_ligne[] = $data['NomLigne'];
}
$presenceLigne = 0;
}$REQ_Total_Arrets_Station->closeCursor();
// **********************
// Création du graphique
// **********************
$graph = new Graph(640,480,"auto");
$graph->SetScale("textlin");
$graph->SetShadow();
$graph->img->SetMargin(60,40,50,40);
$graph->SetMarginColor('#CCCCFF');
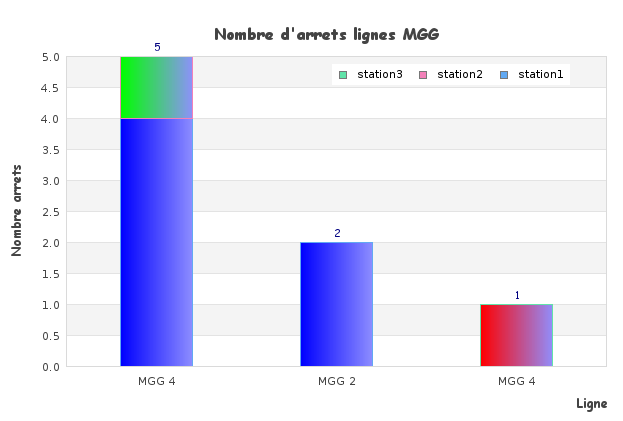
$graph->title->Set("Nombre d'arrets lignes MGG");
$graph->title->SetMargin(20);
$graph->title->SetFont(FF_COMIC,FS_BOLD,12);
// Créer les ensembles d'histogrammes
$station1 = new BarPlot($tab_Station1);
$station1->SetFillGradient('blue', '#9090FF', GRAD_VER);
$station1->SetLegend('Station 155');
$station1->value->Show();
$station1->value->SetFont(FF_ARIAL, FS_NORMAL,7);
$station1->value->SetColor('black');
$station1->value->SetFormat('%d');
$station2 = new BarPlot($tab_Station2);
$station2->SetFillGradient('green', '#9090FF', GRAD_VER);
$station2->SetLegend('Station 160');
$station2->value->Show();
$station2->value->SetFont(FF_ARIAL, FS_NORMAL,7);
$station2->value->SetColor('black');
$station2->value->SetFormat('%d');
$station3 = new BarPlot($tab_Station3);
$station3->SetFillGradient('red', '#9090FF', GRAD_VER);
$station3->SetLegend('Station 157');
$station3->value->Show();
$station3->value->SetFont(FF_ARIAL, FS_NORMAL,7);
$station3->value->SetColor('black');
$station3->value->SetFormat('%d');
// Créer l'ensemble d'histogrammes accumulés
$gbplot = new AccBarPlot(array($station1,$station2,$station3));
// Afficher les valeurs de chaque histogramme groupé
$gbplot->value->Show();
$gbplot->value->SetFont(FF_COMIC,FS_NORMAL,8);
$gbplot->value->SetFormat('%d');
// Position de la légende
$graph->legend->Pos(0.12,0.12,"right","top");
// Ajouter l'ensemble accumulé
$graph->Add($gbplot);
// Paramétrer les axes X et Y
$graph->yaxis->title->Set("Nombre arrets");
$graph->yaxis->title->SetMargin(20);
$graph->yaxis->title->SetFont(FF_COMIC,FS_BOLD);
$graph->xaxis->title->Set("Ligne");
$graph->xaxis->SetTickLabels($tab_ligne);
$graph->xaxis->title->SetMargin(4);
$graph->xaxis->title->SetFont(FF_COMIC,FS_BOLD);
// Afficher l'image générée
$graph->StrokeCSIM();
?> |


 Répondre avec citation


Partager