1
2
3
4
5
6
7
8
9
10
11
12
13
14
15
16
17
18
19
20
21
22
23
24
25
26
27
28
29
30
31
32
33
34
|
> library(ggplot2)
> library(gridExtra)
> tmp <- as.POSIXct(strptime(paste("2015", month.name, "01", sep = "-"), "%Y-%B-%d"))
>
> eg <- data.frame(stretch = tmp, values = runif(length(tmp), .0, .6))
>
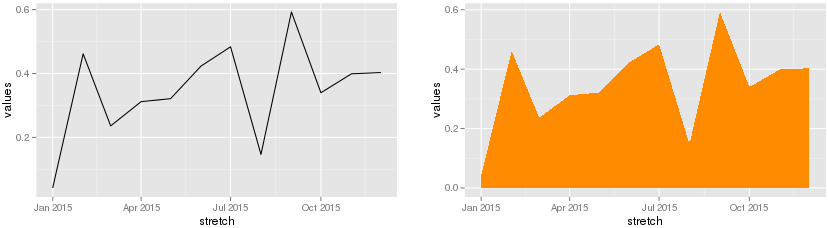
> drawing <- ggplot(data = eg, aes(x = stretch, y = values)) +
+ geom_line() +
+ scale_x_datetime()
>
> hatched_drawing <- ggplot(data = eg, aes(x = stretch, y = values)) +
+ geom_area(fill = "darkorange") +
+ scale_x_datetime()
>
> print(drawing)
Error in seq.int(0, to0 - from, by) : 'to' cannot be NA, NaN or infinite
> print(hatched_drawing)
Error in get(name, envir = asNamespace(pkg), inherits = FALSE) :
object 'rversion' not found
Graphics error: Error in get(name, envir = asNamespace(pkg), inherits = FALSE) :
object 'rversion' not found
Error in matrix(value, n, p) :
'data' must be of a vector type, was 'NULL'
In addition: Warning message:
Removed 12 rows containing missing values (position_stack).
> grid.arrange(drawing, hatched_drawing, ncol = 2L)
Error in get(name, envir = asNamespace(pkg), inherits = FALSE) :
object 'rversion' not found
Graphics error: Error in get(name, envir = asNamespace(pkg), inherits = FALSE) :
object 'rversion' not found
Error in seq.int(0, to0 - from, by) : 'to' cannot be NA, NaN or infinite |


 Répondre avec citation


Partager