1
2
3
4
5
6
7
8
9
10
11
12
13
14
15
16
17
18
19
20
21
22
23
24
25
26
27
28
29
30
31
32
33
34
35
36
37
38
39
40
41
42
43
44
45
46
47
48
49
50
51
52
53
54
55
56
57
58
59
60
61
62
63
64
65
66
67
68
69
70
71
72
73
74
75
76
77
78
79
80
81
82
83
84
|
clear all
fld = load('amsua_ch8_mpi.txt');
lat=fld(:,1);
lon=fld(:,2);
data=fld(:,3);
lat_ref=[0:1:90];
lon_ref=[-180:1:179.17];
n=length(lat_ref);
m=length(lon_ref);
data_agreg=zeros(n,m);
for i=1:n;
for j=1:m;
[II]=find(lat<=lat_ref(i)+0.5 & lat>=lat_ref(i)-0.5);
[JJ]=find(lon<=lon_ref(j)+0.5 & lon>=lon_ref(j)-0.5);
inx_com=intersect(II,JJ);
data_agreg(i,j)=mean(data(inx_com));
end
end
[xlon_ref,xlat_ref]=meshgrid(lon_ref,lat_ref);
%%%% geographic parameters %%%%%%%%%%%%%%%%%%%%%%%%%%%%%%%%%%%
%%%%%%%%%%%%%%%%%%%%%%%%%%%%%%%%%%%%%%%%%%%%%%%%%%%%%%%%%%%%
Grd_dx = 0.44;
Grd_dy = 0.44;
Grd_ni = 172 ;
Grd_nj = 160 ;
Grd_iref = 1 ;
Grd_jref = 140 ;
Grd_lonr = 146.12 ;
Grd_latr = 28.365 ;
Grd_xlat1 = 47.50;
Grd_xlon1 = -97.00;
Grd_xlat2 = 0.0 ;
Grd_xlon2 = -7.00;
Halo_ni=0;
Halo_nj=0;
%geometry
az=azimuth(Grd_xlat1,Grd_xlon1,Grd_xlat2,Grd_xlon2);
lon_min=Grd_lonr-(Grd_iref-Halo_ni)*Grd_dx;
lon_max=Grd_lonr+(Grd_ni-Grd_iref-Halo_ni)*Grd_dx;
lat_min=Grd_latr-(Grd_jref-Halo_nj)*Grd_dy;
lat_max=Grd_latr+(Grd_nj-Grd_jref-Halo_nj)*Grd_dy;
LeftLimit=-(180-lon_min);
RightLimit=lon_max-180+Grd_dx;
UpLimit=lat_max+Grd_dy;
DownLimit=lat_min;
minlat1=min(min(xlat_ref));
maxlat2=max(max(xlat_ref));
minlon1=min(min(xlon_ref));
maxlon2=max(max(xlon_ref));
% %%%%%%%%%%%%%%%%%%%%%%%%%%%%%%%%%%%%%%%%%%%%%%%%%%%%%%%%%%%%%%%%%%%%%
% %%%%%%%%%%%%%%%%%%%%%%%%%%%%%%%%%%%%%%%%%%%%%%%%%%%%%%%%%%%%%%%%%%%%%
countries = shaperead('/world_countries_boundary_file_world_2002.shp',...
'UseGeoCoords', true);
axesm('MapProjection','eqdcylin','Origin',[47.50 -97.00 90-az],'FLonLimit',[LeftLimit RightLimit],'FLatLimit',[DownLimit UpLimit],'frame','on','FlineWidth',2,'FFill',400,'grid','on','MeridianLabel','off','ParallelLabel','off','MLabelParallel','south')
geoshow(countries,'DefaultFaceColor','white');
% textm(lat,lon, num2str(data), 'FontSize',14)
%geoshow(lat,lon,'displaytype','point','markeredgecolor','k','markerfacecolor','g','marker','s');
coast = load('coast.mat');
hold on
pcolorm(xlat_ref,xlon_ref,data_agreg)
set(0,'Units','pixels')
caxis ([-6 6])
colormap(jet(12))
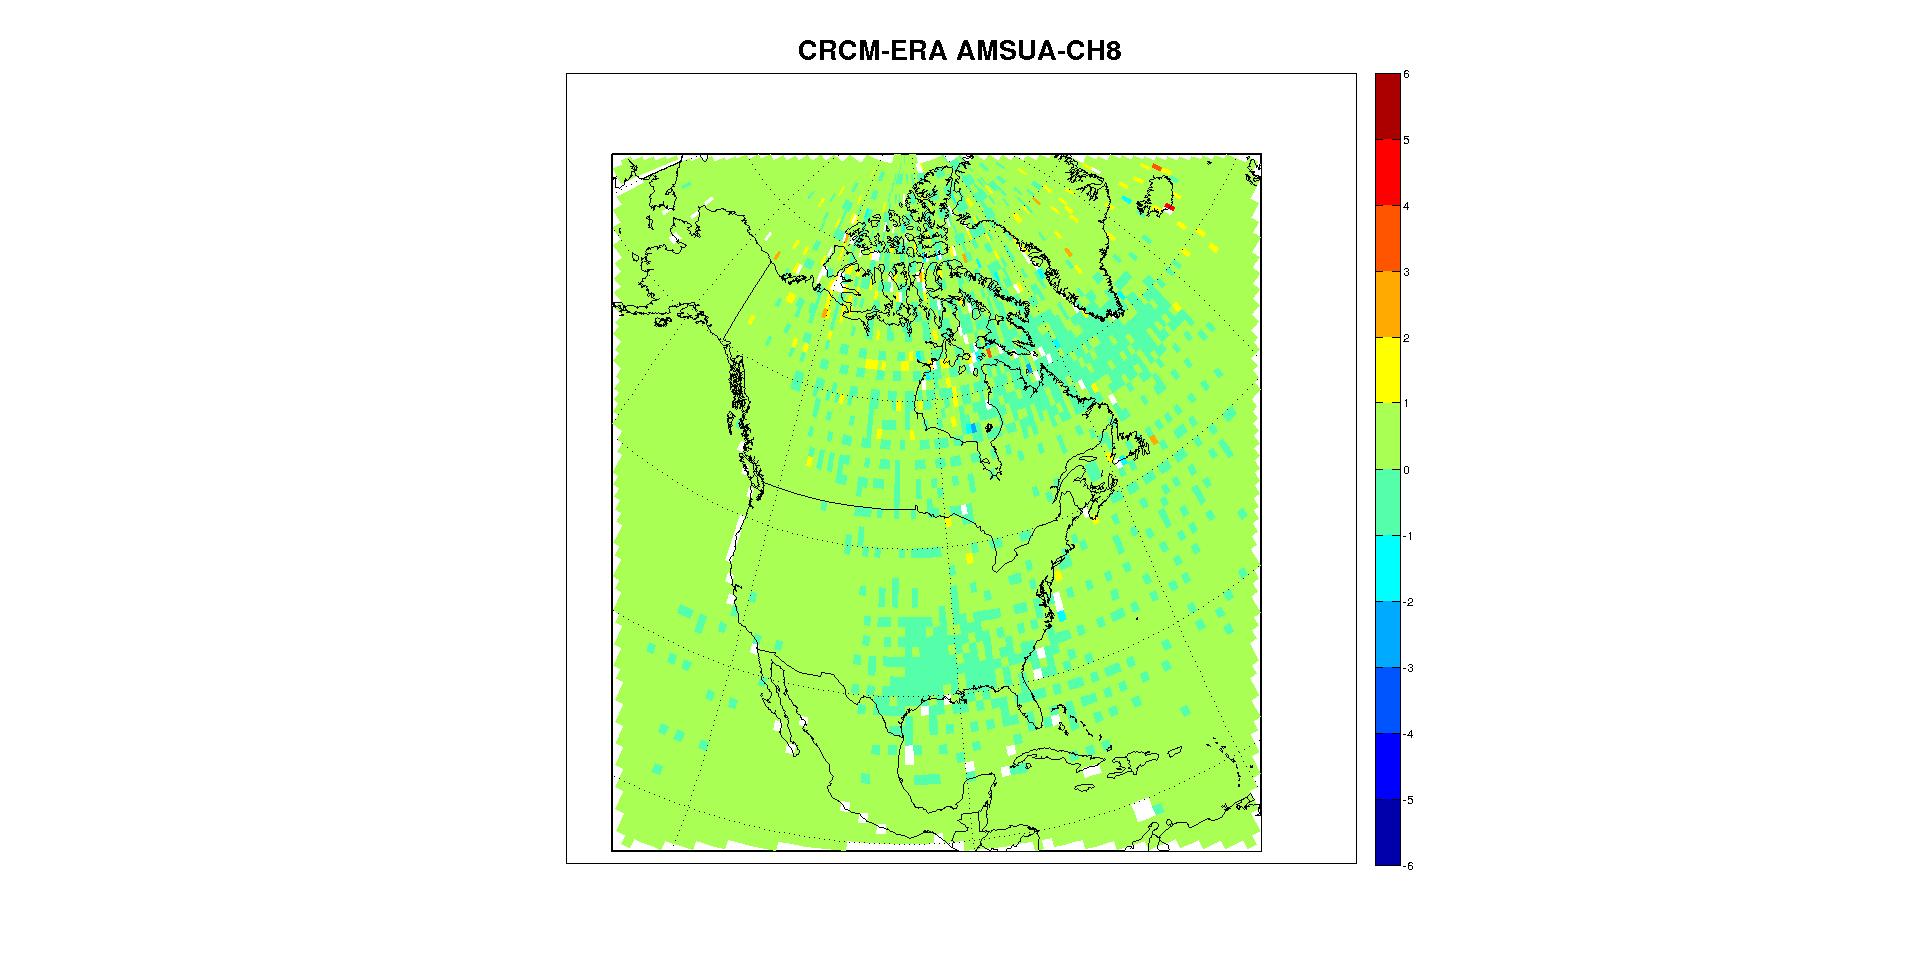
title('CRCM-MPI AMSUA-CH8','FontSize',22,'FontWeight','bold')
c=colorbar;
set (c,'ytick',-6:1:6,'FontSize',18,'FontWeight','bold')
hold off |


 Répondre avec citation
Partager