1
2
3
4
5
6
7
8
9
10
11
12
13
14
15
16
17
18
19
20
21
22
23
24
25
26
27
28
29
30
31
32
33
34
35
36
37
38
39
40
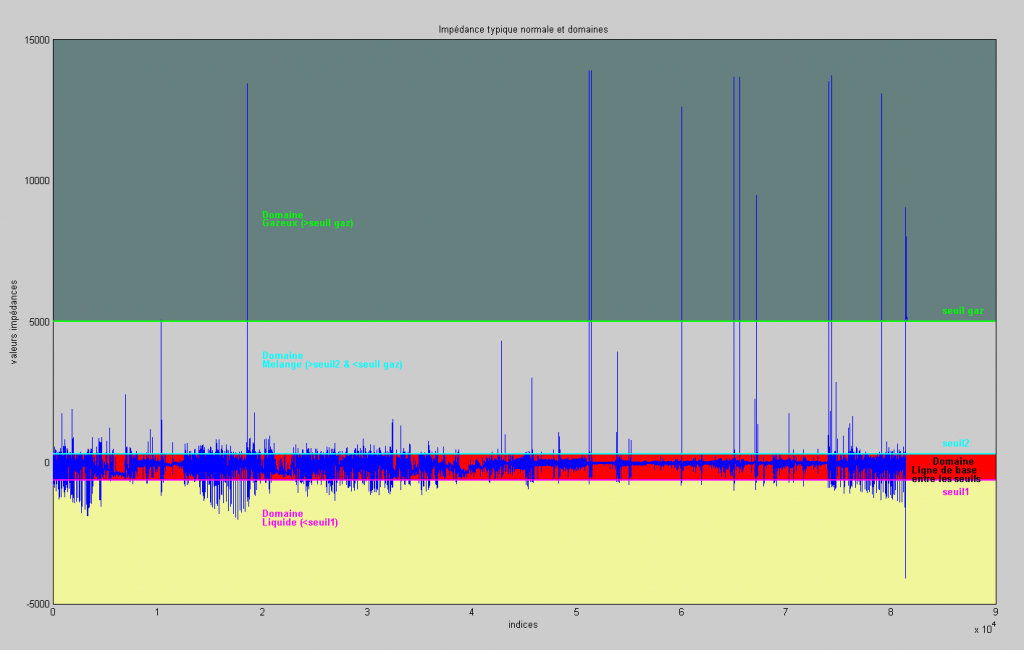
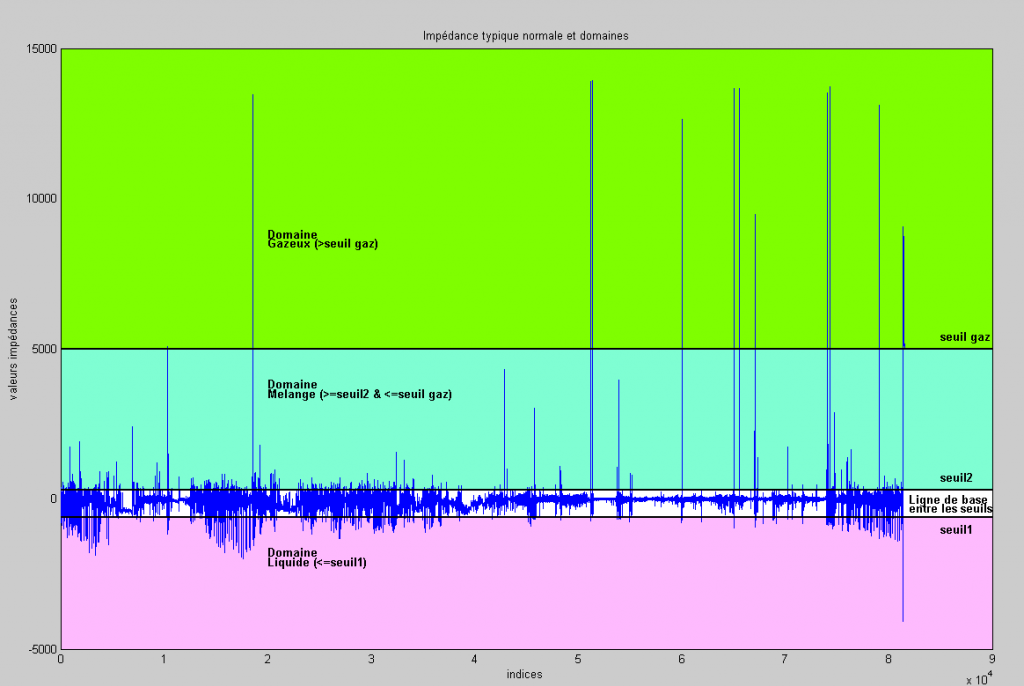
| figure(2)
Y = [seuil1 seuil2-seuil1 5000-seuil2 10000;
    seuil1 seuil2-seuil1 5000-seuil2 10000];
X = [0 0 0 0;
    90000 90000 90000 90000;];
h = area(X,Y);
set(h,'basevalue',-5000)
set(h(1),'facecolor',[242/256 247/256 155/256]);%jaune pale
set(h(2),'facecolor',[1 0 0]);%vert pale
set(h(3),'facecolor',[0.8 0.8 0.8]);%bleu pale
set(h(4),'facecolor',[0.4 0.5 0.5]);%coouleur moche

hold on
plot(valeurs_Imp1_normale,'b')
hold on
hold on
plot([0 90000], [seuil1 seuil1],'m','linewidth',2)
hold on
text(85000,seuil1-400,'{\bfseuil1}','Color','m')
hold on
plot([0 90000], [seuil2 seuil2],'c','linewidth',2)
hold on
text(85000,seuil2+400,'{\bfseuil2}','Color','c')
hold on
plot([0 90000], [5001 5000],'g','linewidth',2)
hold on
text(85000,5000+400,'{\bfseuil gaz}','Color','g')
hold on
hold on
text(84000,seuil2-260,'{\bfDomaine}','Color','k')
text(82000,seuil2-560,'{\bfLigne de base}','Color','k')
text(82000,seuil2-860,'{\bfentre les seuils}','Color','k')
text(20020,seuil2-2100,'{\bfDomaine}','Color','m')
text(20020,seuil2-2400,'{\bfLiquide (<seuil1)}','Color','m')
text(20020,seuil2+3500,'{\bfDomaine}','Color','c')
text(20020,seuil2+3200,'{\bfMelange (>seuil2 & <seuil gaz)}','Color','c')
text(20020,seuil2+8500,'{\bfDomaine}','Color','g')
text(20020,seuil2+8200,'{\bfGazeux (>seuil gaz)}','Color','g')
title('Impédance typique normale et domaines')
xlabel('indices')
ylabel('valeurs impédances') |


 Répondre avec citation


Partager