<?php // content="text/plain; charset=utf-8"
include ('src/jpgraph.php');
include ('src/jpgraph_bar.php');
$a=$_GET['a'];
$b=$_GET['b'];
$c=$_GET['c'];
$d=$_GET['d'];
$e=$_GET['e'];
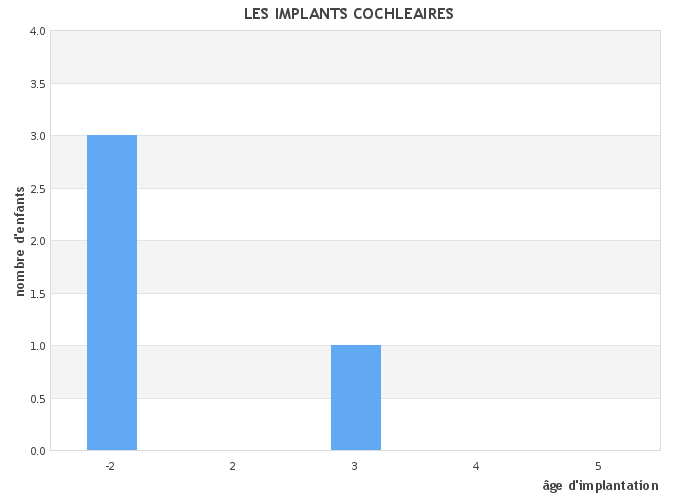
$datay=array($a,$b,$c,$d,$e);
$datax=array('-2',2,3,4,5);
$valmax=max($datay)+1;
// *********************
// Création du graphique
// *********************
// Construction du conteneur
// Spécification largeur et hauteur
$graph = new Graph(700,500);
// Représentation linéaire
$graph->SetScale("textlin",0,$valmax);
// Ajouter une ombre au conteneur
$graph->SetShadow();
// Fixer les marges
$graph->img->SetMargin(50,40,30,50);
// Création du graphique histogramme
$bplot = new BarPlot($datay);
// Spécification des couleurs des barres
$bplot->SetFillColor('blue');
// Une ombre pour chaque barre
$bplot->SetShadow();
// Afficher les valeurs pour chaque barre
$bplot->value->Show();
// Fixer l'aspect de la police
$bplot->value->SetFont(FF_ARIAL,FS_BOLD,10);
// Modifier le rendu de chaque valeur
$bplot->value->SetFormat('%d');
// Ajouter les barres au conteneur
$graph->Add($bplot);
// Le titre
$graph->title->Set("LES IMPLANTS COCHLEAIRES");
$graph->title->SetFont(FF_TREBUCHE,FS_BOLD,12);
// Titre pour l'axe horizontal #axe x# et vertical #axe y#
$graph->xaxis->title->Set("âge d'implantation");
$graph->yaxis->title->Set("nombre d'enfants");
$graph->yaxis->title->SetFont(FF_TREBUCHE,FS_BOLD,10);
$graph->xaxis->title->SetFont(FF_TREBUCHE,FS_BOLD,10);
// Légendre pour l'axe horizontal
$graph->xaxis->SetTickLabels($datax);
// Afficher le graphique
$graph->Stroke();
?>


 Répondre avec citation


Partager