1
2
3
4
5
6
7
8
9
10
11
12
13
14
15
16
17
18
19
20
21
22
23
24
25
26
27
28
29
30
31
32
33
34
35
36
37
38
| [F0]= freqfond(signal)
fs=8000;
% signal=double(signal);
ms1=fs/1000; % maximum speech F0 at 1000Hz
ms2= fs/50; % minimum speech F0 at 50 Hz
%plot wave form
t=(0:length(signal)-1)/fs; %time of sampling instants
subplot(3,1,1);
plot(t,signal);
legend('Waveform');
xlabel('Time (s)');
ylabel('Amplitude');
%
% do fourier transform of windowed signal
X= fft(signal.*hamming(length(signal)));
%
% plot spectrum of bottom 5000 Hz
hz5000=5000*length(X)/fs;
f= (0:hz5000)*fs/length(X);
subplot(3,1,2);
plot(f,20*log10(abs(X(1:length(f)))+eps));
legend('Spectrum');
xlabel('Frequency (Hz)');
ylabel('Magnitude (db)');
%
% cepstrum is DFT of log spectrum
% C=fft(log(abs(X)+eps));
C=fft(log(abs(X)+eps));
% plot between 1ms (=1000Hz) and 20ms (=50Hz)
freqfond=(ms1:ms2)/fs;
subplot(3,1,3);
plot(freqfond,abs(C(ms1:ms2)))
legend('Cepstrum');
xlabel('Quefrency (s)');
ylabel('Amplitude');
[c,f0]=max(abs(C(ms1:ms2)));
fprintf('F0=%Hz\n',fs/(ms1+f0+1));
F0=fs/(ms1+f0+1); |


il me reste peu de temps pour achevez mon projet de fin dÉtude et je me trouve bloqué
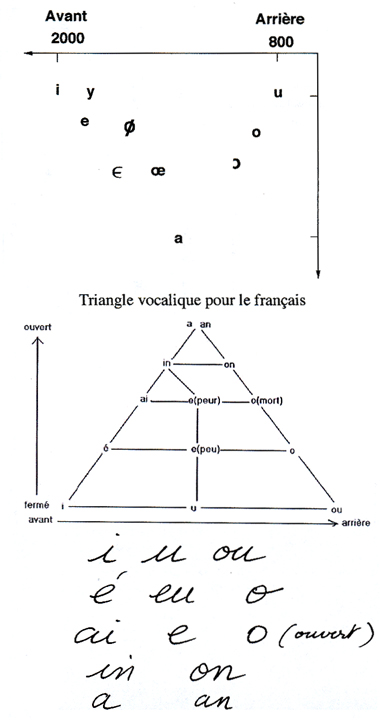
. Je travaille sur la reconnaissance vocale de mot isolé. J'ai enregistré ma base de données maintenant je doit extraire les paramètres je trouve une difficulté a avoir le triangle vocalique pour voir si ma classification donne des bon résultat ou pas donc je cherche un code matlab qui calcule la fréquence fondamentale et sur tous les deux 1er harmoniques F1 et F2 dans les plus bref délai je vous prie. je vous serai trés reconnaissante.
 Répondre avec citation


Partager